Poll: Speaker Mike Johnson and Republicans in Disarray
This Navigator Research report contains polling data on Americans’ latest perceptions on how Americans view Republicans in Congress in the aftermath of taking more than three weeks to elect a new Speaker of the House, including how the public describes how Republicans behaved during that time, initial perceptions of new House Speaker Mike Johnson, and the top concerns about his positions on issues as he begins his speakership.
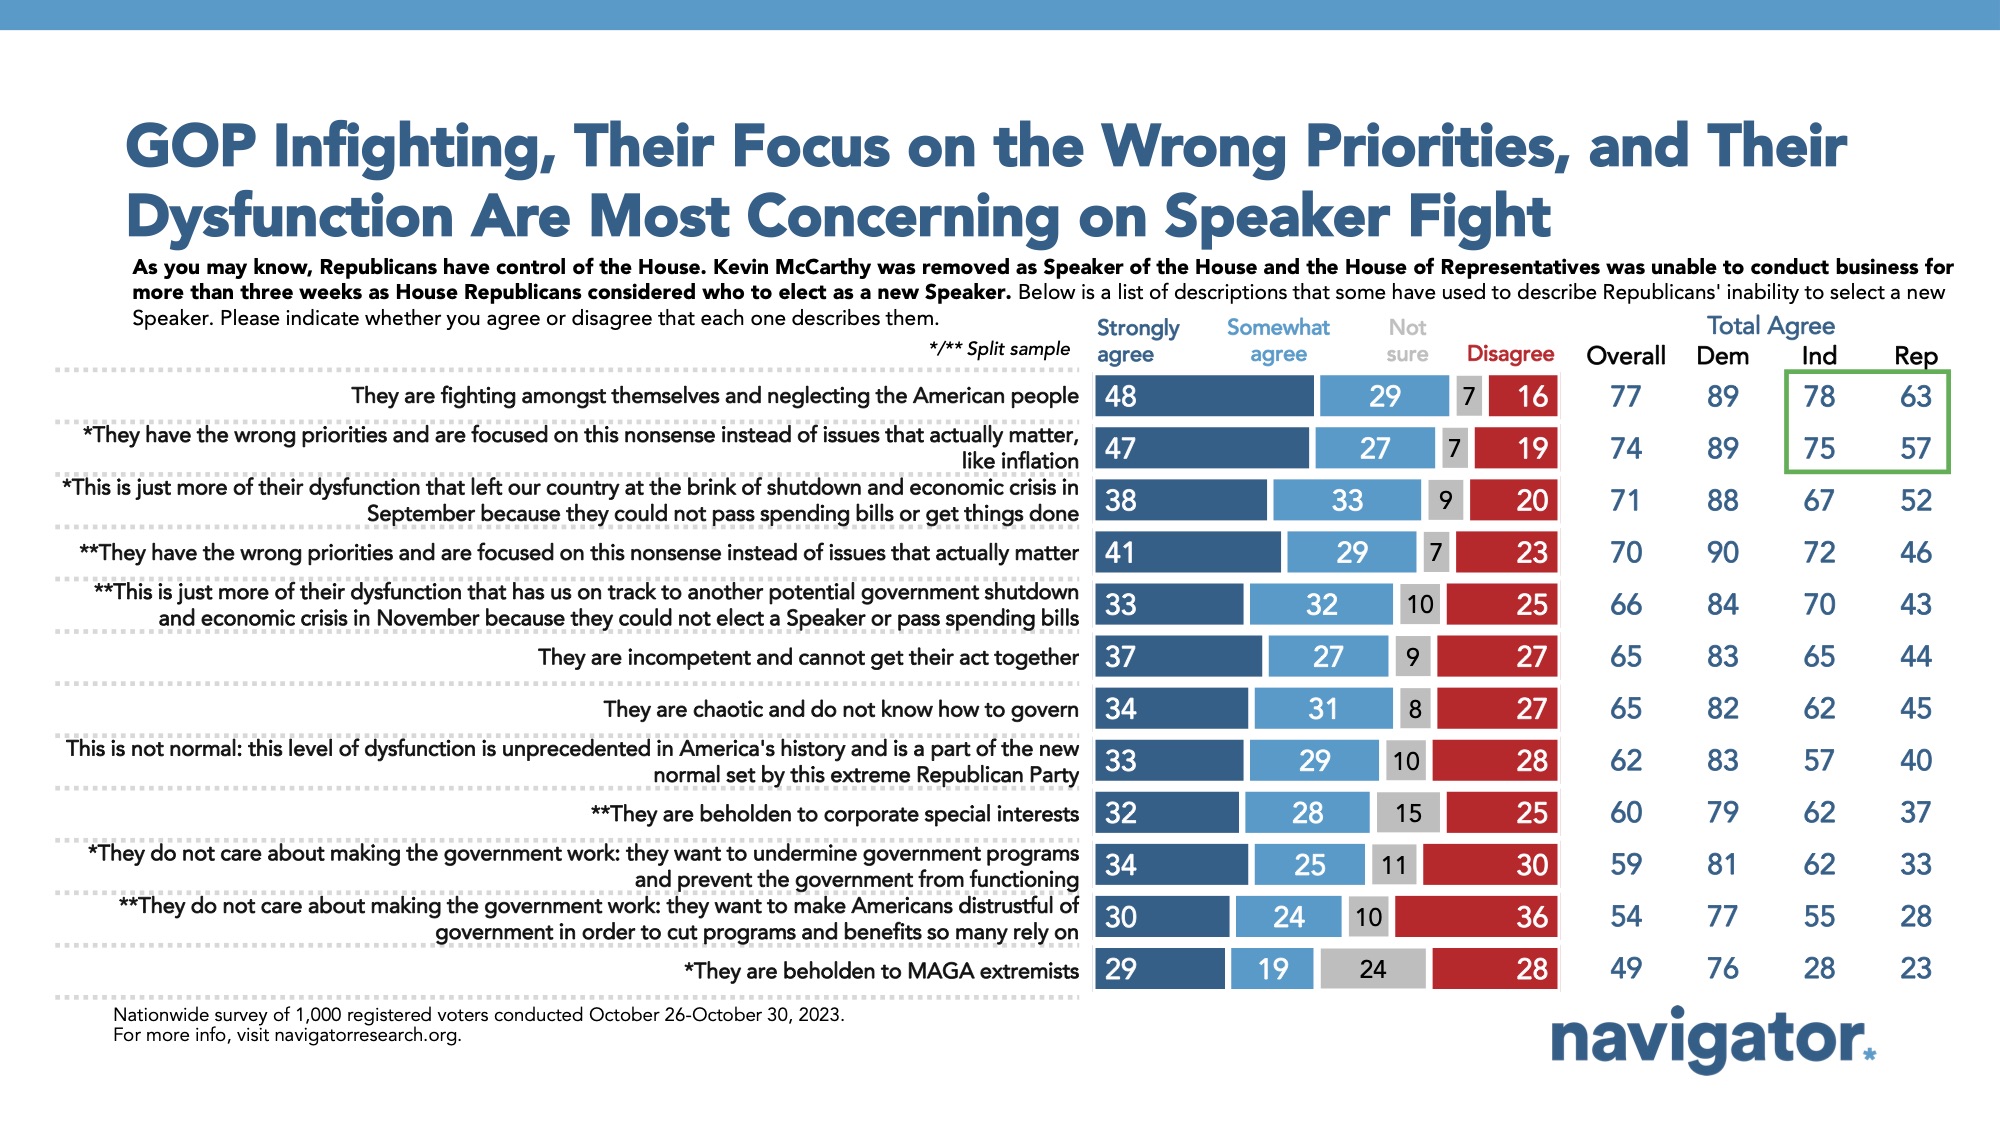
Seven in ten Americans agree that Republicans’ infighting over the speakership showed that their dysfunction came at the expense of getting things done.
Following the multi-week inability of Republicans in Congress to elect a new House Speaker, most agree it shows they were fighting among themselves and focused on the wrong things instead of issues that matter to the American people. Among a list of statements tested, the ones Americans agreed the most included that “they are fighting amongst themselves and neglecting the American people” (net +61; 77 percent agree – 16 percent disagree, including 78 percent of independents and 63 percent of Republicans), that “they have the wrong priorities and are focused on this nonsense instead of issues that actually matter, like inflation” (net +55; 74 percent agree – 19 percent disagree, including 75 percent of independents and 57 percent of Republicans), and that “this is just more of their dysfunction that left our country at the brink of shutdown and economic crisis in September because they could not pass spending bills or get things done” (net +51; 71 percent agree – 20 percent disagree, including 67 percent of independents and 52 percent of Republicans).
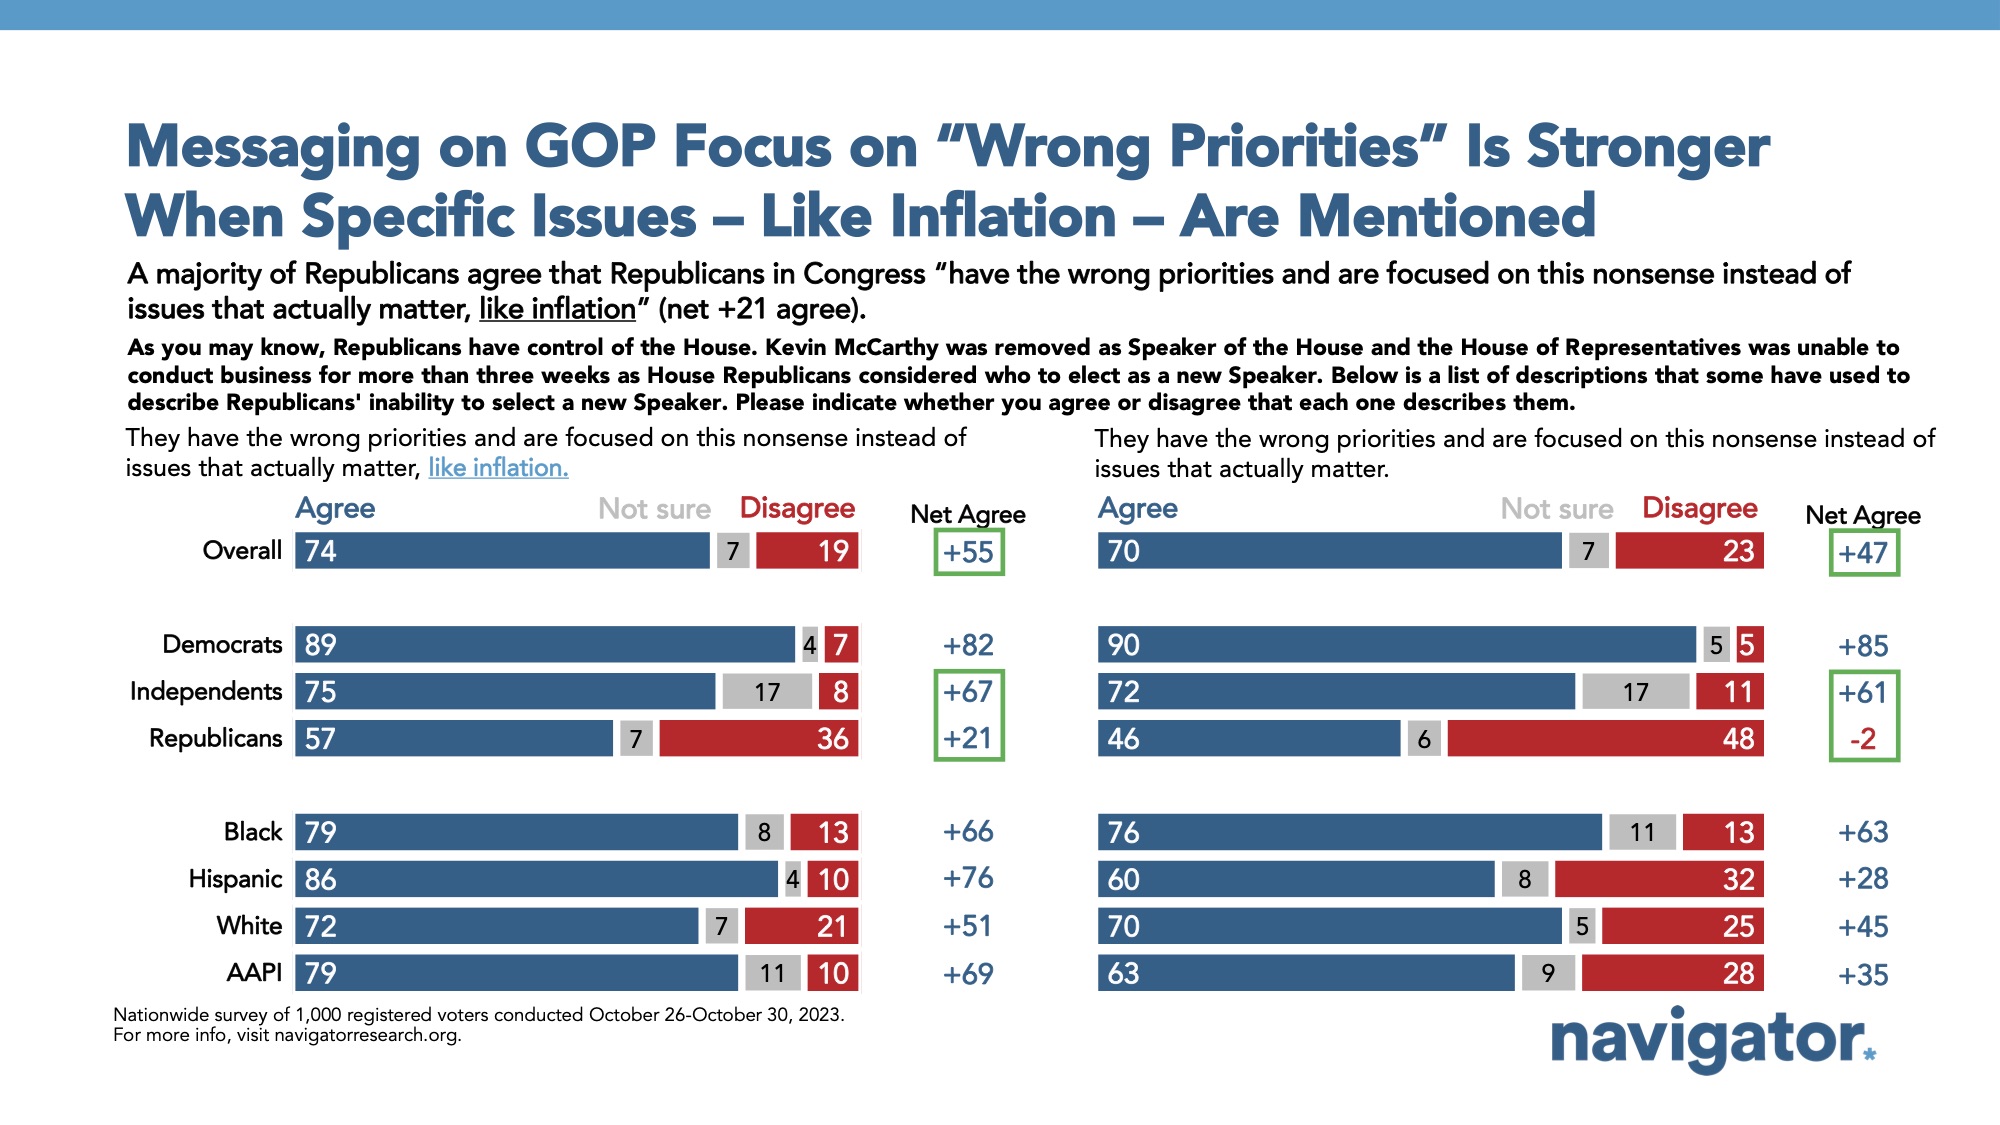
- It is more effective to name inflation as one of the issues that Republicans are failing to focus on because of their wrong priorities and dysfunction (net +55; 74 percent agree – 19 percent disagree) instead of making the same argument without naming inflation or other issues (net +47; 70 percent agree – 23 percent disagree).
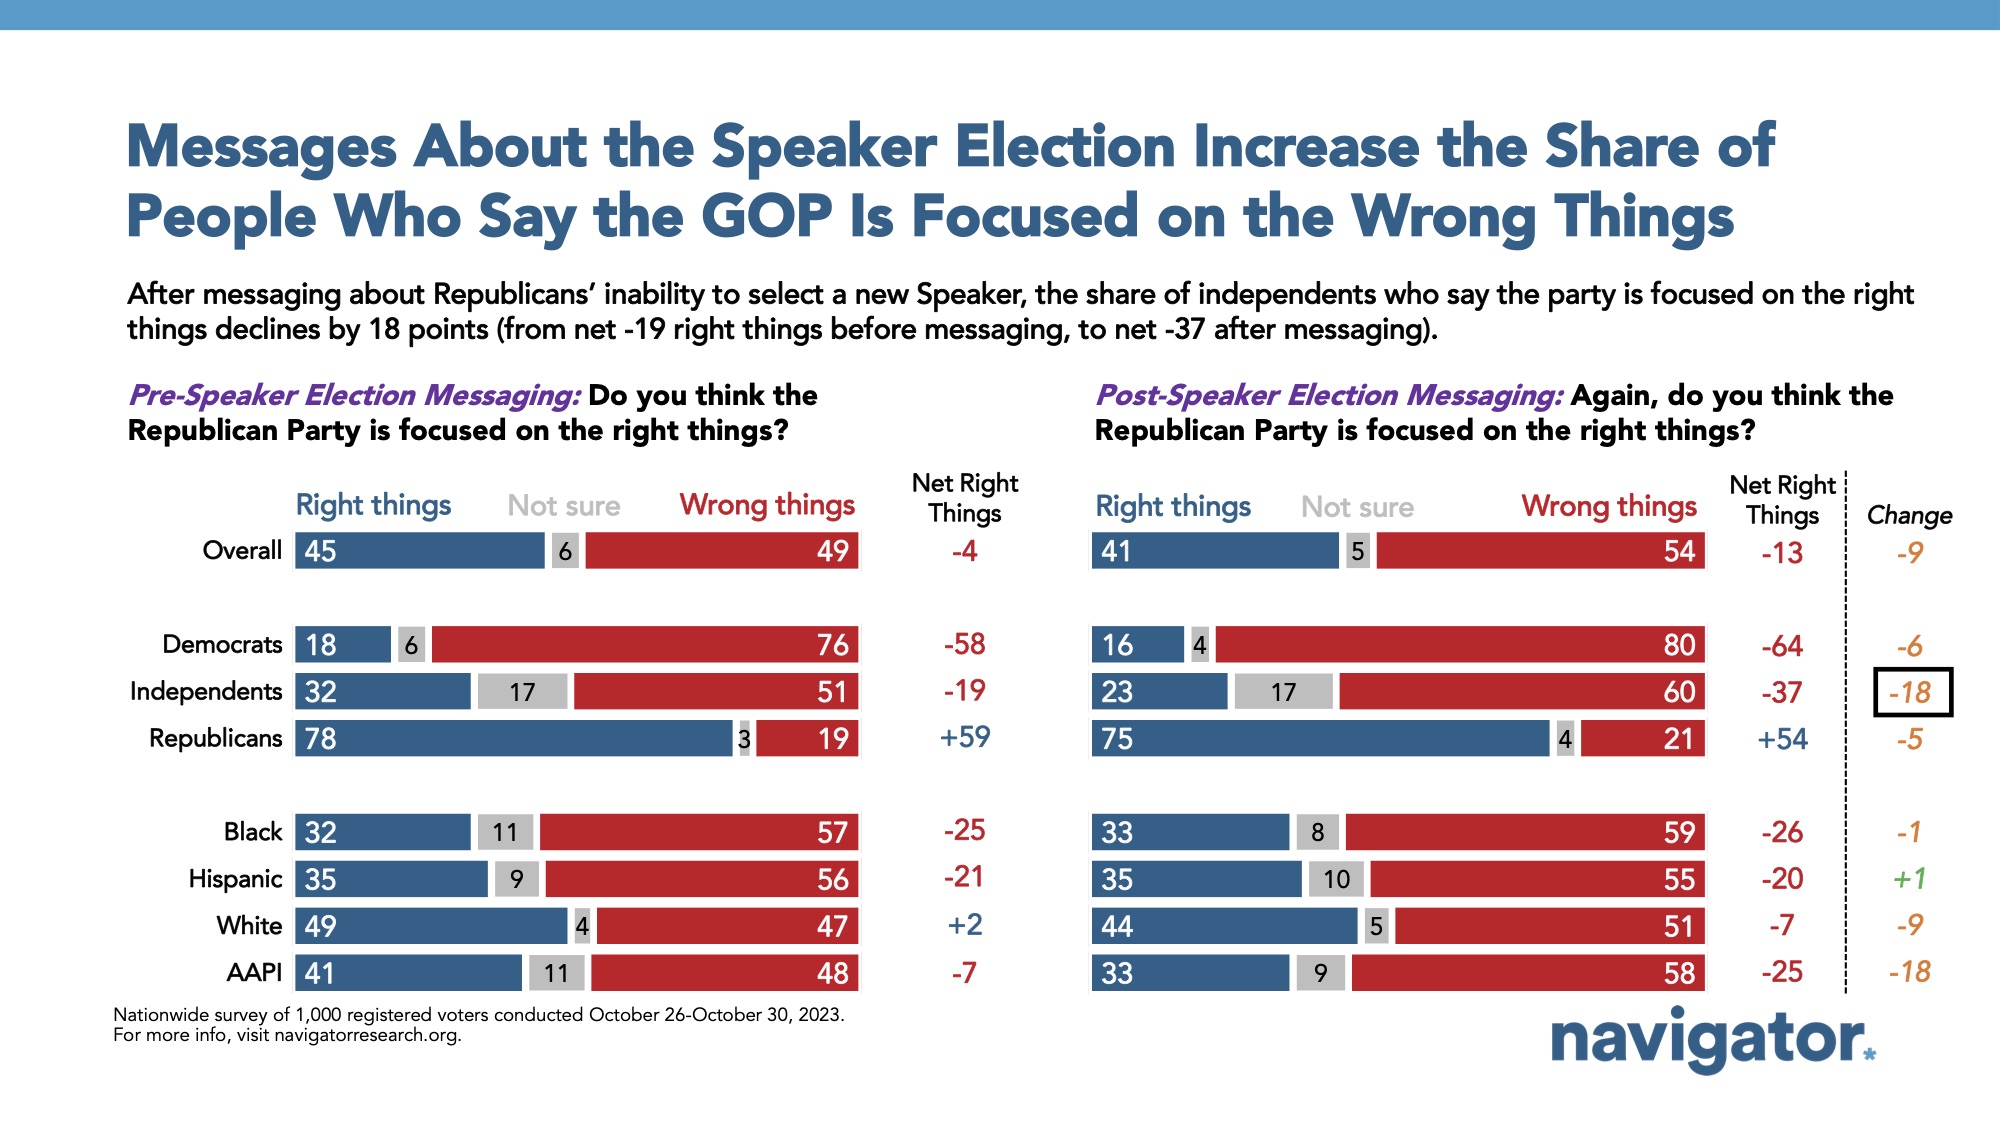
- When people hear about Republicans in Congress’ inability to elect a Speaker, they shift from believing the Republican Party is focused on the wrong things by 4 points (net -4; 45 percent right things – 49 percent wrong things) to being underwater by 13 points (41 percent right things – 54 percent wrong things), with a net -18 shift among independents (from net -19 initially to net -37, 23 percent right things – 60 percent wrong things).
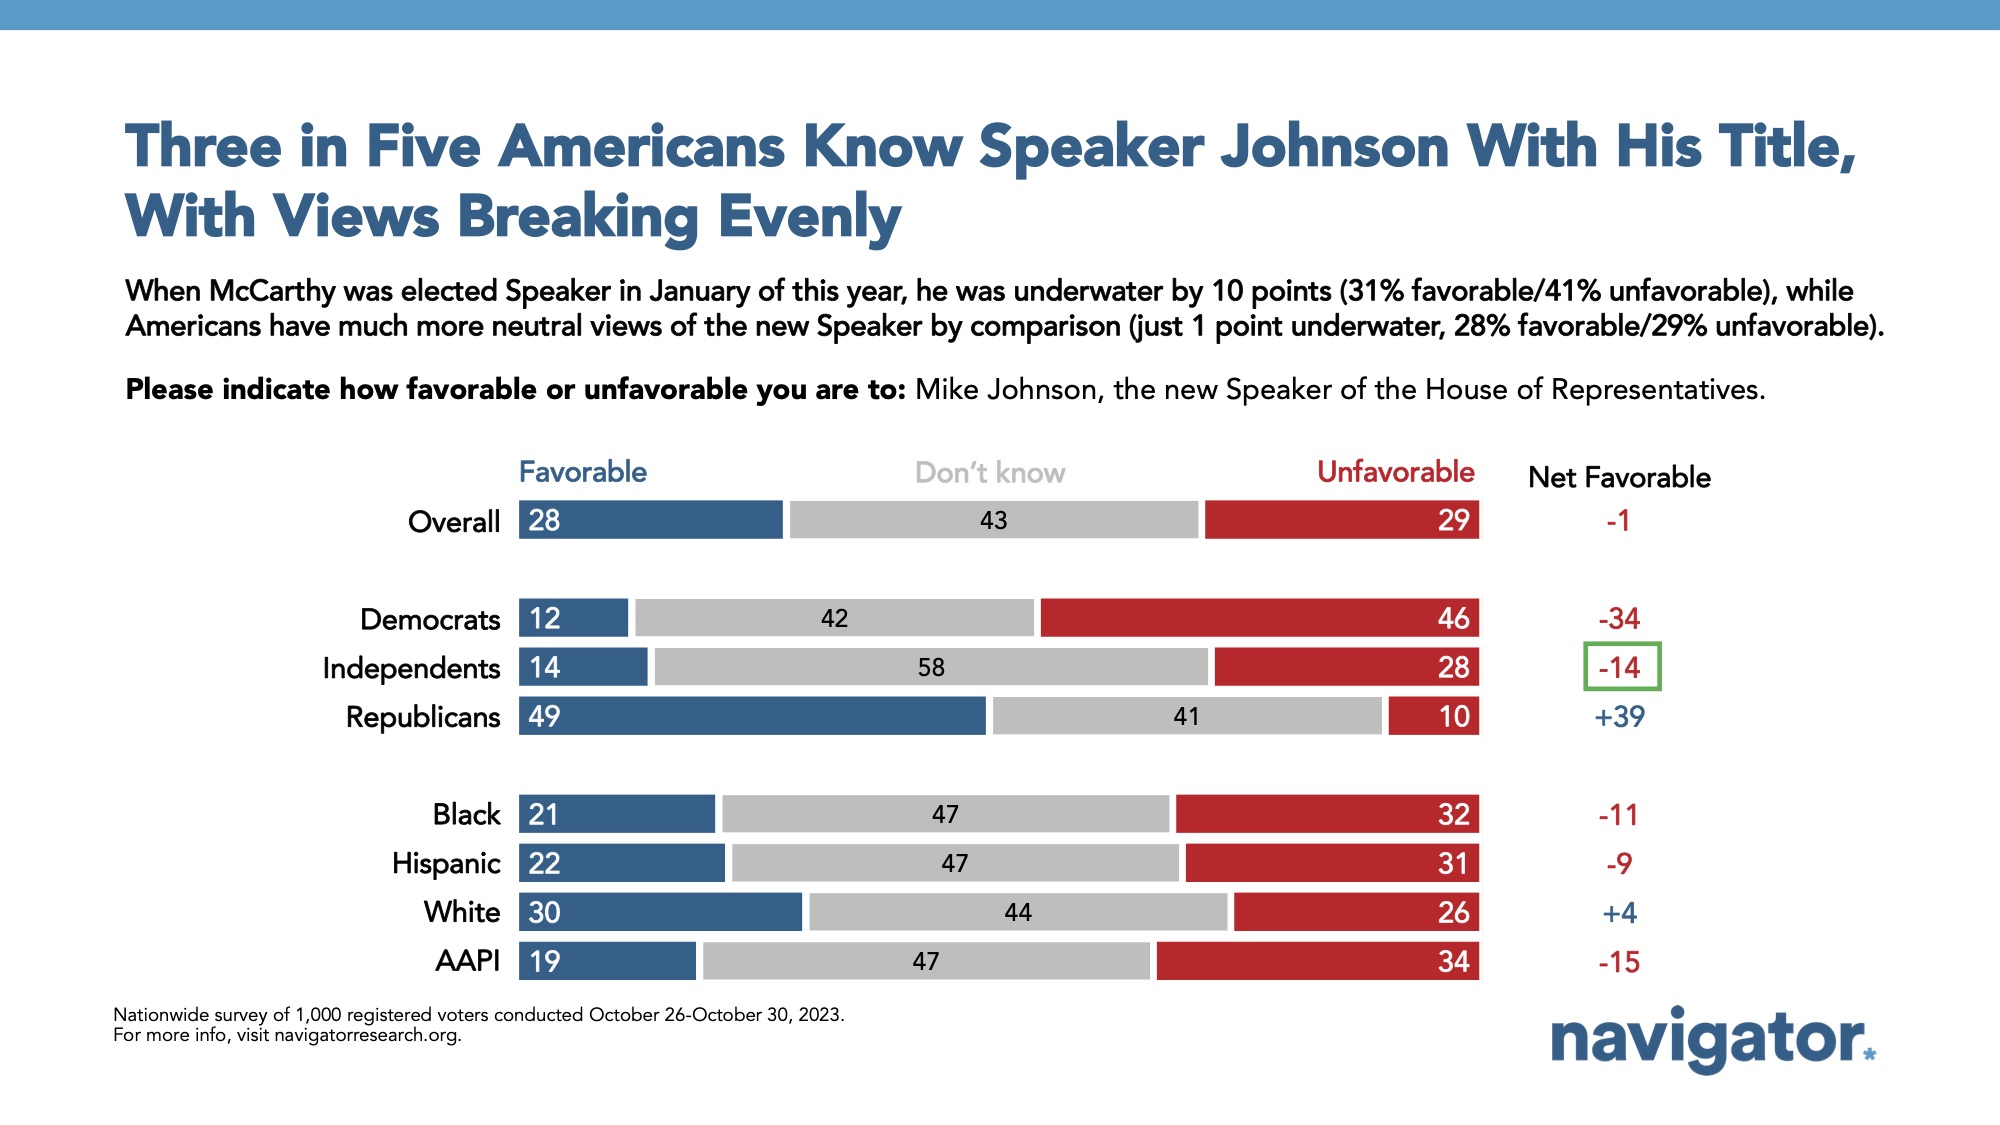
At the start of his term, Speaker Johnson’s favorability ratings is evenly split, with nearly half who don’t know enough yet to rate him at all.
Johnson’s net favorability starts off at net -1 (28 percent favorable – 29 percent unfavorable), with 44 percent of Americans either saying they don’t know or that they have never heard of him. Ratings of Johnson start off negative among Democrats (net -34; 12 percent favorable – 46 percent unfavorable) and positive among Republicans (net +39; 49 percent favorable – 10 percent unfavorable), and while most independents don’t know know enough to say, they rate Johnson negatively by a two-to-one margin (net -14; 14 percent favorable – 28 percent unfavorable). At least 40 percent of Americans across partisanship are unfamiliar with Johnson.
- By comparison, negative ratings of Johnson are less than they were when Kevin McCarthy became Speaker of the House at the beginning of this Congress. In late January after McCarthy clinched the speakership, his net favorability rating was net -10 (31 percent favorable – 41 percent unfavorable), with his negative ratings 13 points higher than Johnson has now. Following McCarthy’s ousting as Speaker, his favorability is now 20 points underwater (26 percent favorable – 46 percent unfavorable), including a third of Republicans who view him unfavorably (net +10; 42 percent favorable – 32 percent unfavorable).
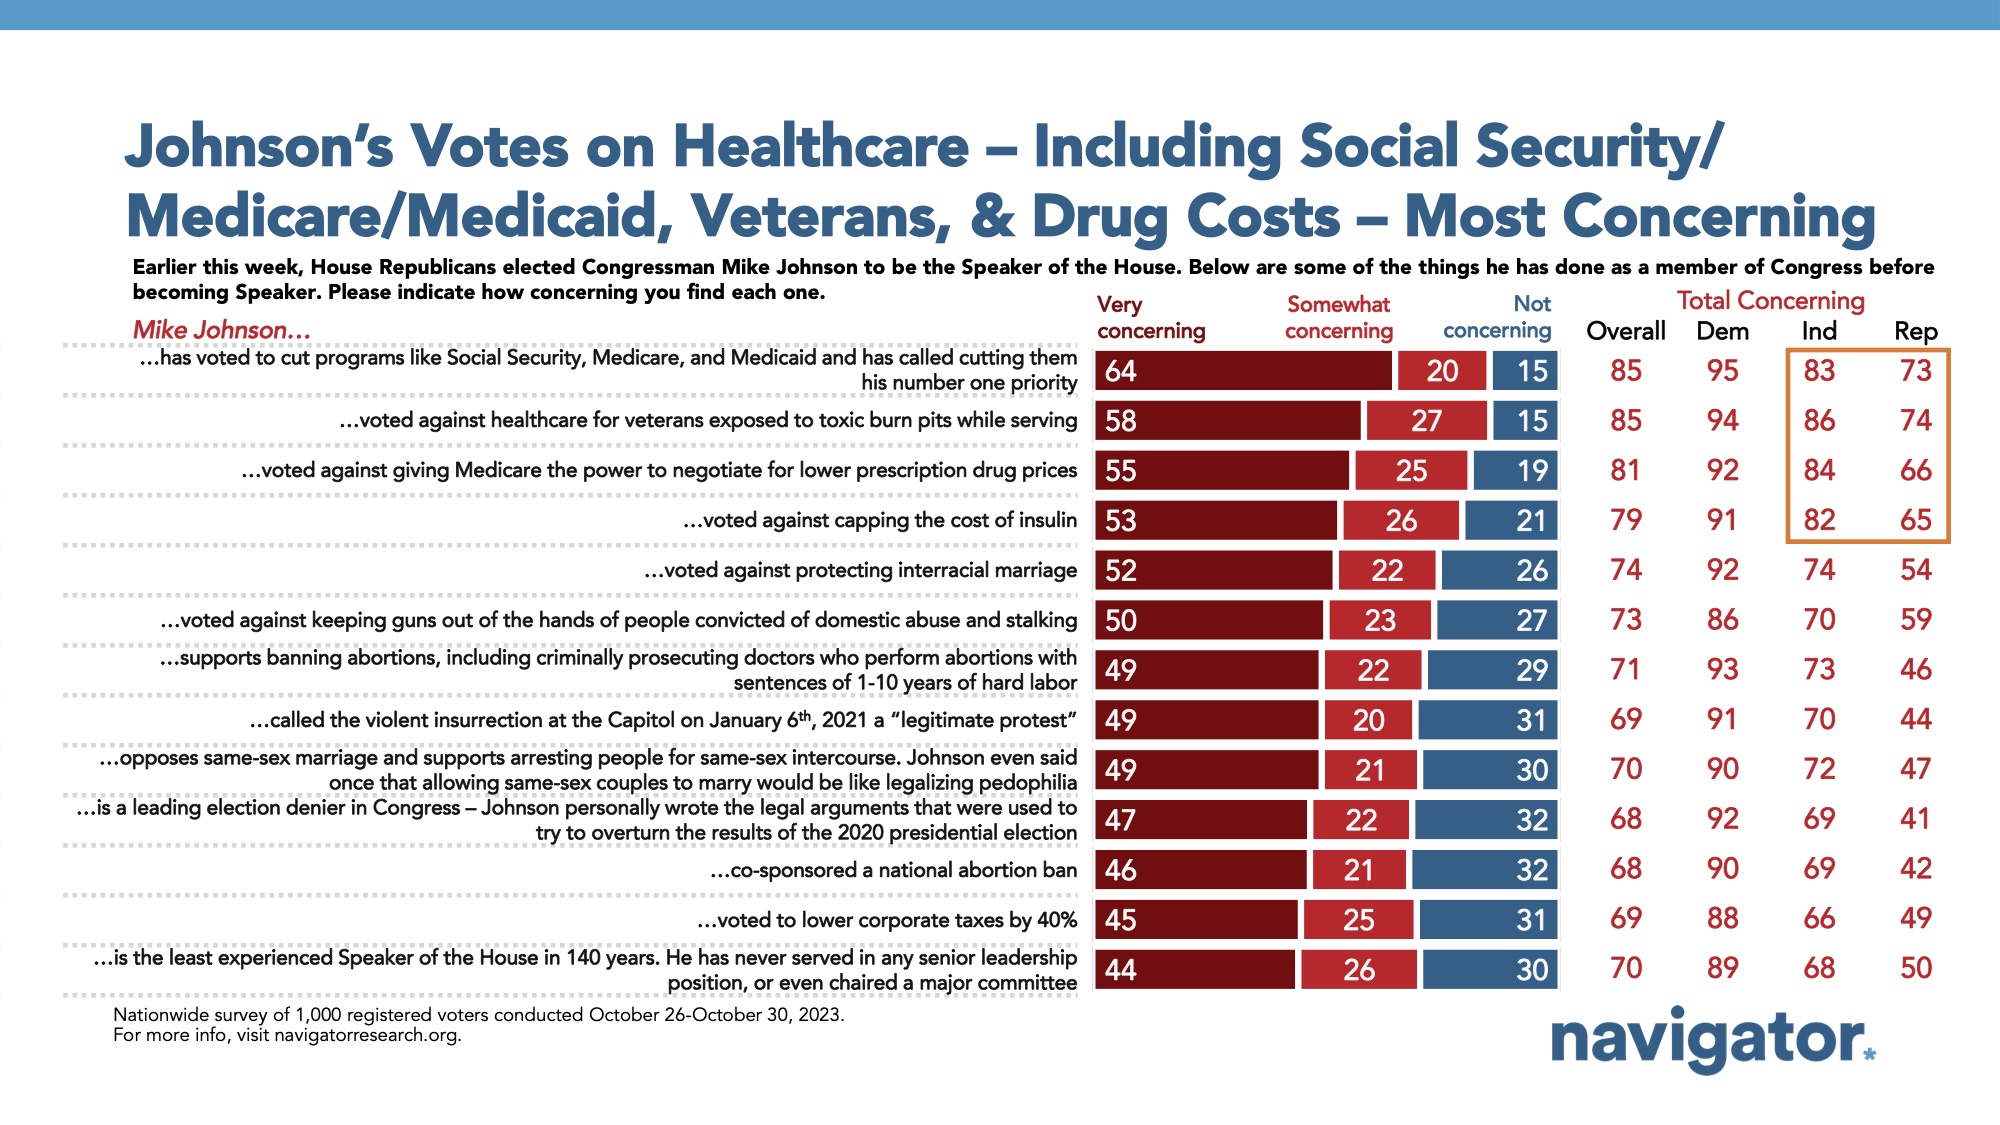
Four in five Americans express concern about a number of Speaker Johnson’s past issue positions and votes while in Congress, especially the economic consequences for working families and seniors.
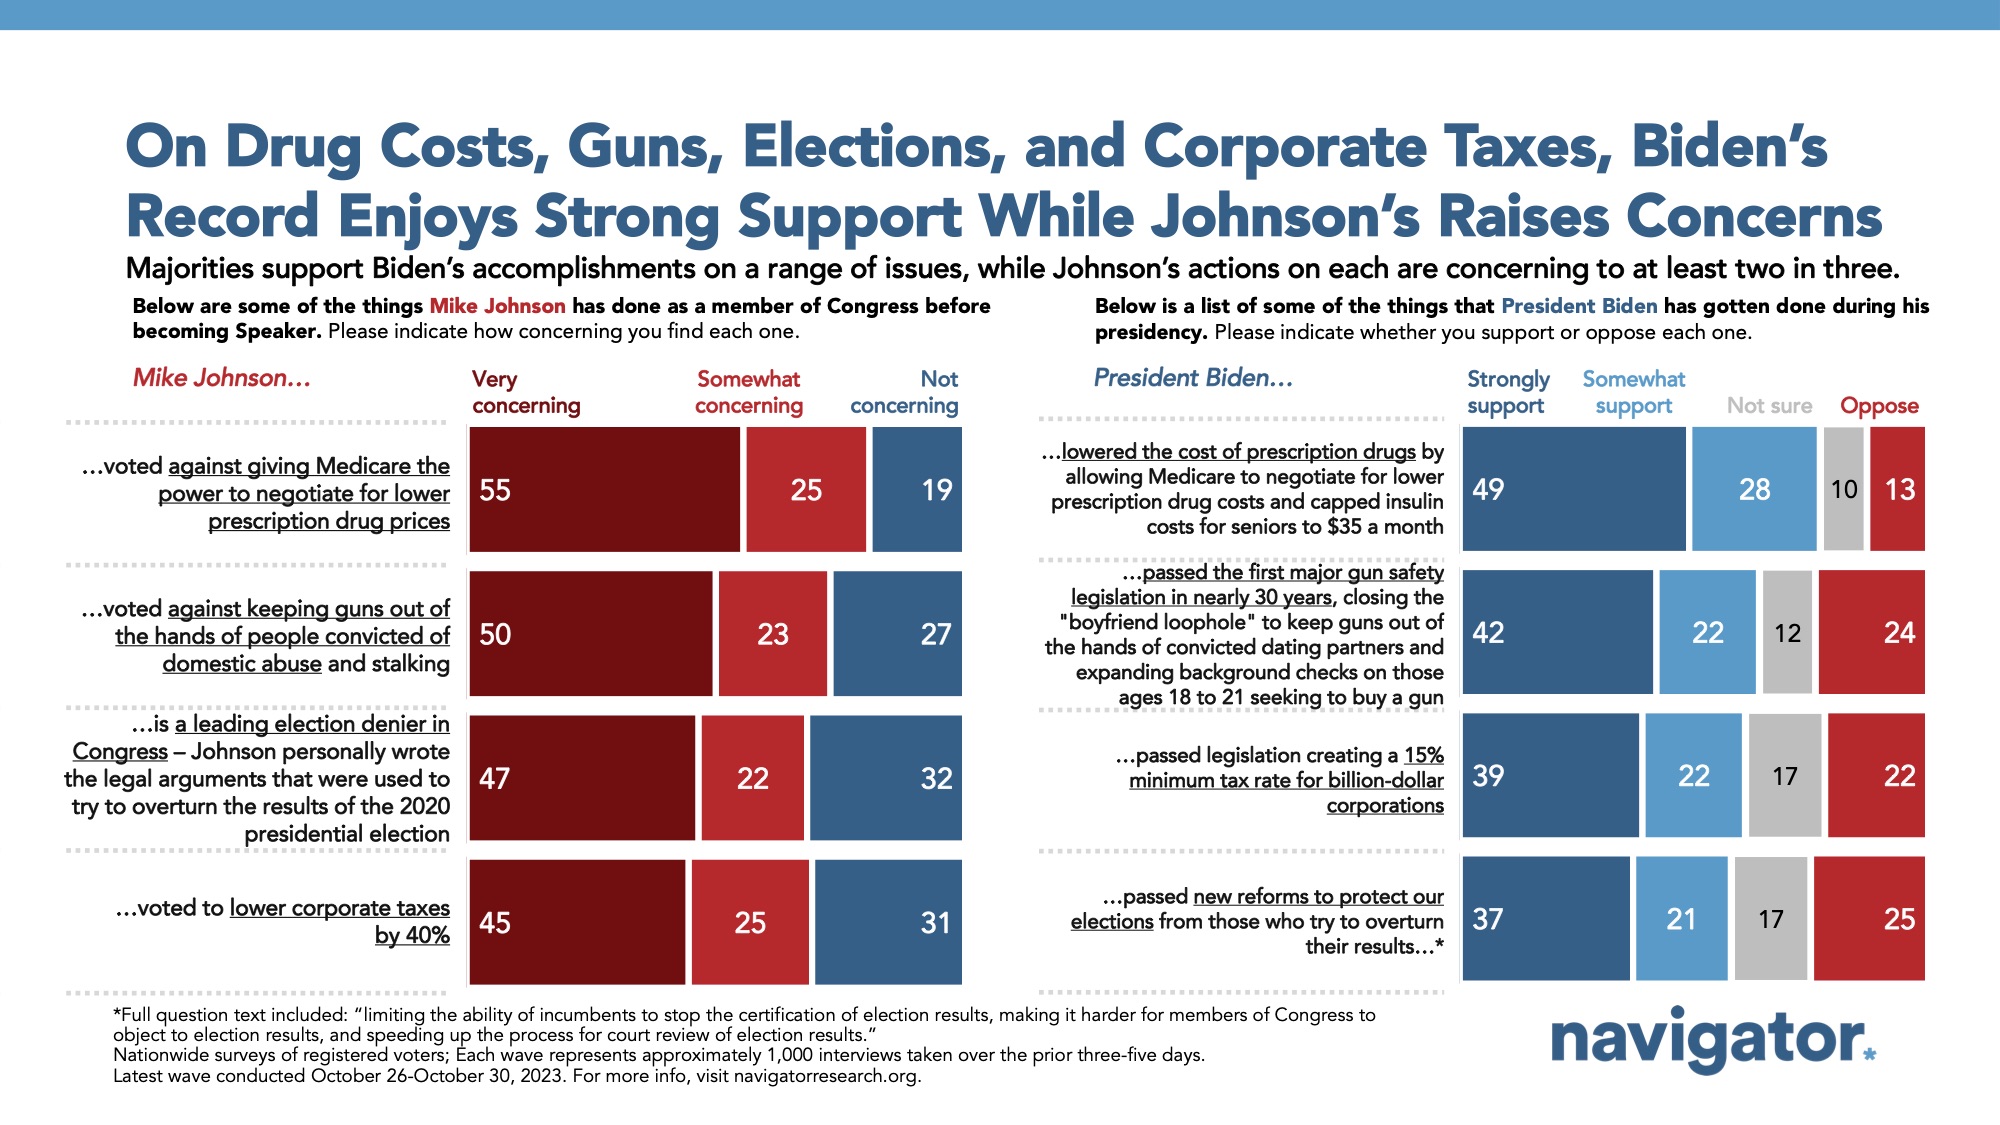
The top concerns with Speaker Johnson’s record include that he “has voted to cut programs like Social Security, Medicare, and Medicaid and has called cutting them his number one priority” (85 percent find this concerning, including 83 percent of independents and 73 percent of Republicans), that he “voted against healthcare for veterans exposed to toxic burn pits while serving” (86 percent find this concerning, including 86 percent of independents and 74 percent of Republicans), that he “voted against giving Medicare the power to negotiate for lower prescription drug prices” (81 percent find this concerning, including 84 percent of independents and 66 percent of Republicans), and that he “voted against capping the cost of insulin” (79 percent find this concerning, including 82 percent of independents and 65 percent of Republicans).
Other top concerns from over seven in ten Americans include:
- Mike Johnson voted against protecting interracial marriage (74 percent find this concerning, including 74 percent of independents and 54 percent of Republicans);
- Mike Johnson voted against keeping guns out of the hands of people convicted of domestic abuse and stalking (73 percent find this concerning, including 70 percent of independents and 59 percent of Republicans); and,
- Mike Johnson supports banning abortions, including criminally prosecuting doctors who perform abortions with sentences of 1-10 years of hard labor (71 percent find this concerning, including 73 percent of independents and 46 percent of Republicans).
About The Study
Global Strategy Group conducted public opinion surveys among a sample of 1,000 registered voters from October 26-October 30, 2023. 100 additional interviews were conducted among Hispanic voters. 75 additional interviews were conducted among Asian American and Pacific Islander voters. 100 additional interviews were conducted among African American voters. 100 additional interviews were conducted among independent voters. 100 additional interviews were conducted among voters ages 18-34. The survey was conducted online, recruiting respondents from an opt-in online panel vendor. Respondents were verified against a voter file and special care was taken to ensure the demographic composition of our sample matched that of the national registered voter population across a variety of demographic variables.

