Background & Methodology
Navigator Research launched in April 2018 and conducts monthly research geared to understanding the American public’s views on issues of the day and help advocates, elected officials, and other interested parties understand the language and messaging needed to make and win key policy arguments.
There have been four waves of Navigator so far. All research is conducted by Global Strategy Group and GBA Strategies among a nationally representative sample of registered voters online and verified against a voter file:
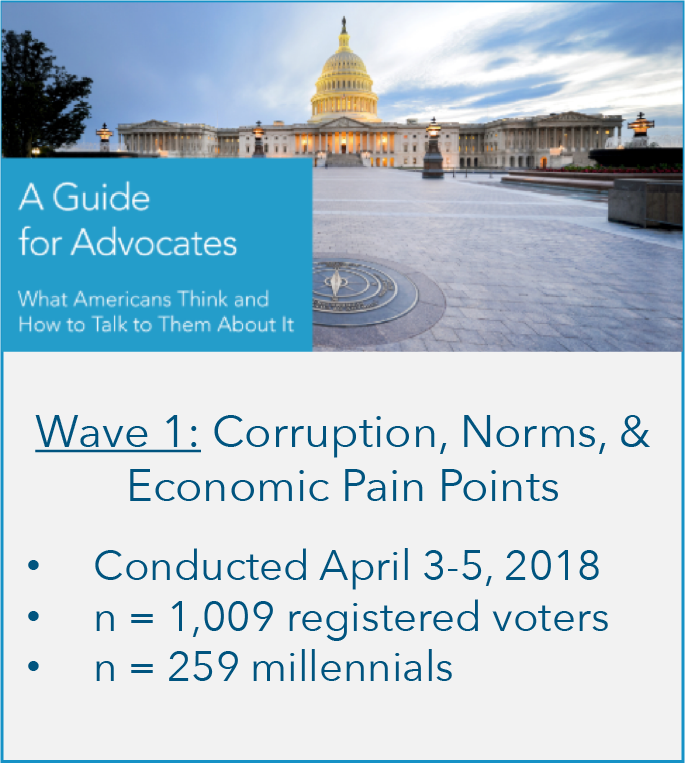
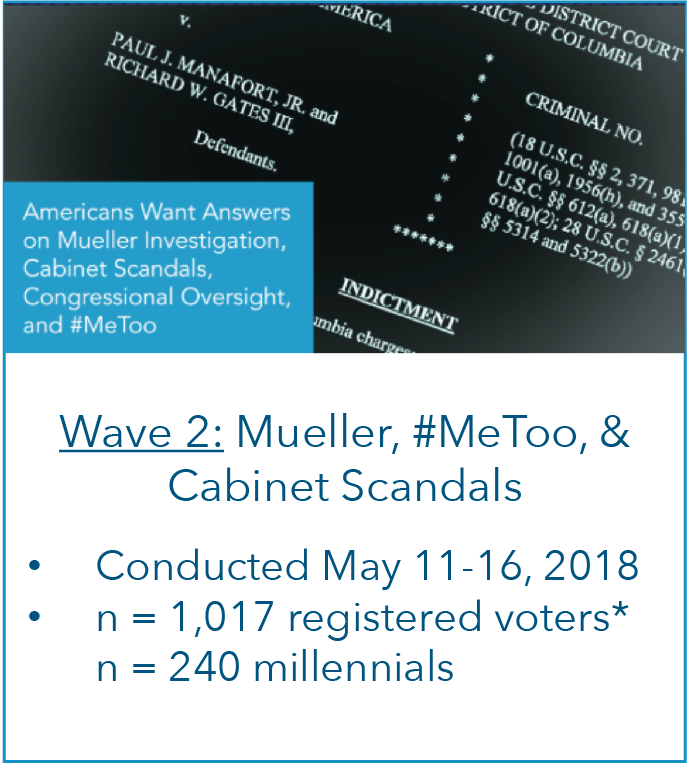
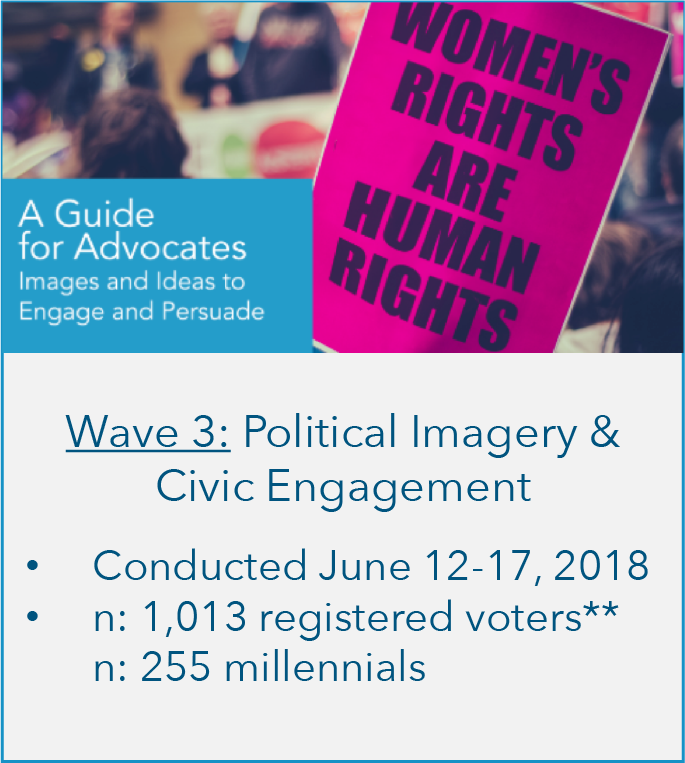
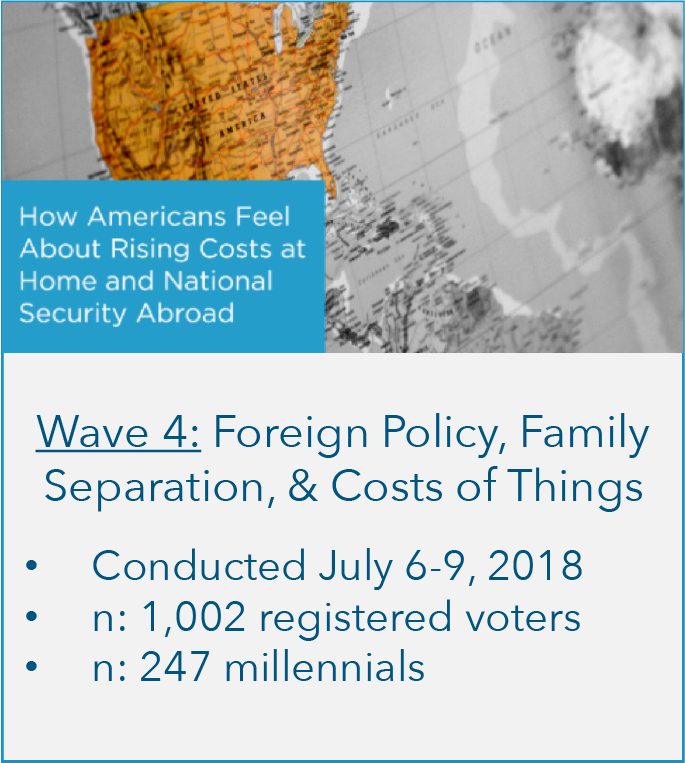
*An oversample of pure independent voters was included in this wave of research.
**An oversample of millennial voters and an oversample of black voters were included in this wave of research.
What You’ll See in This Report
This report focuses on millennial voters. For the purposes of this report, we define millennials as 18-34 year olds.
We want to know who they are and what they look like, how they are similar and different from the nation as a whole on core political metrics, and how they think about the topics we’ve approached in the first few waves of Navigator.
To answer these main questions, this report is divided into the following sections:
1 | Profile of Millennial Voters
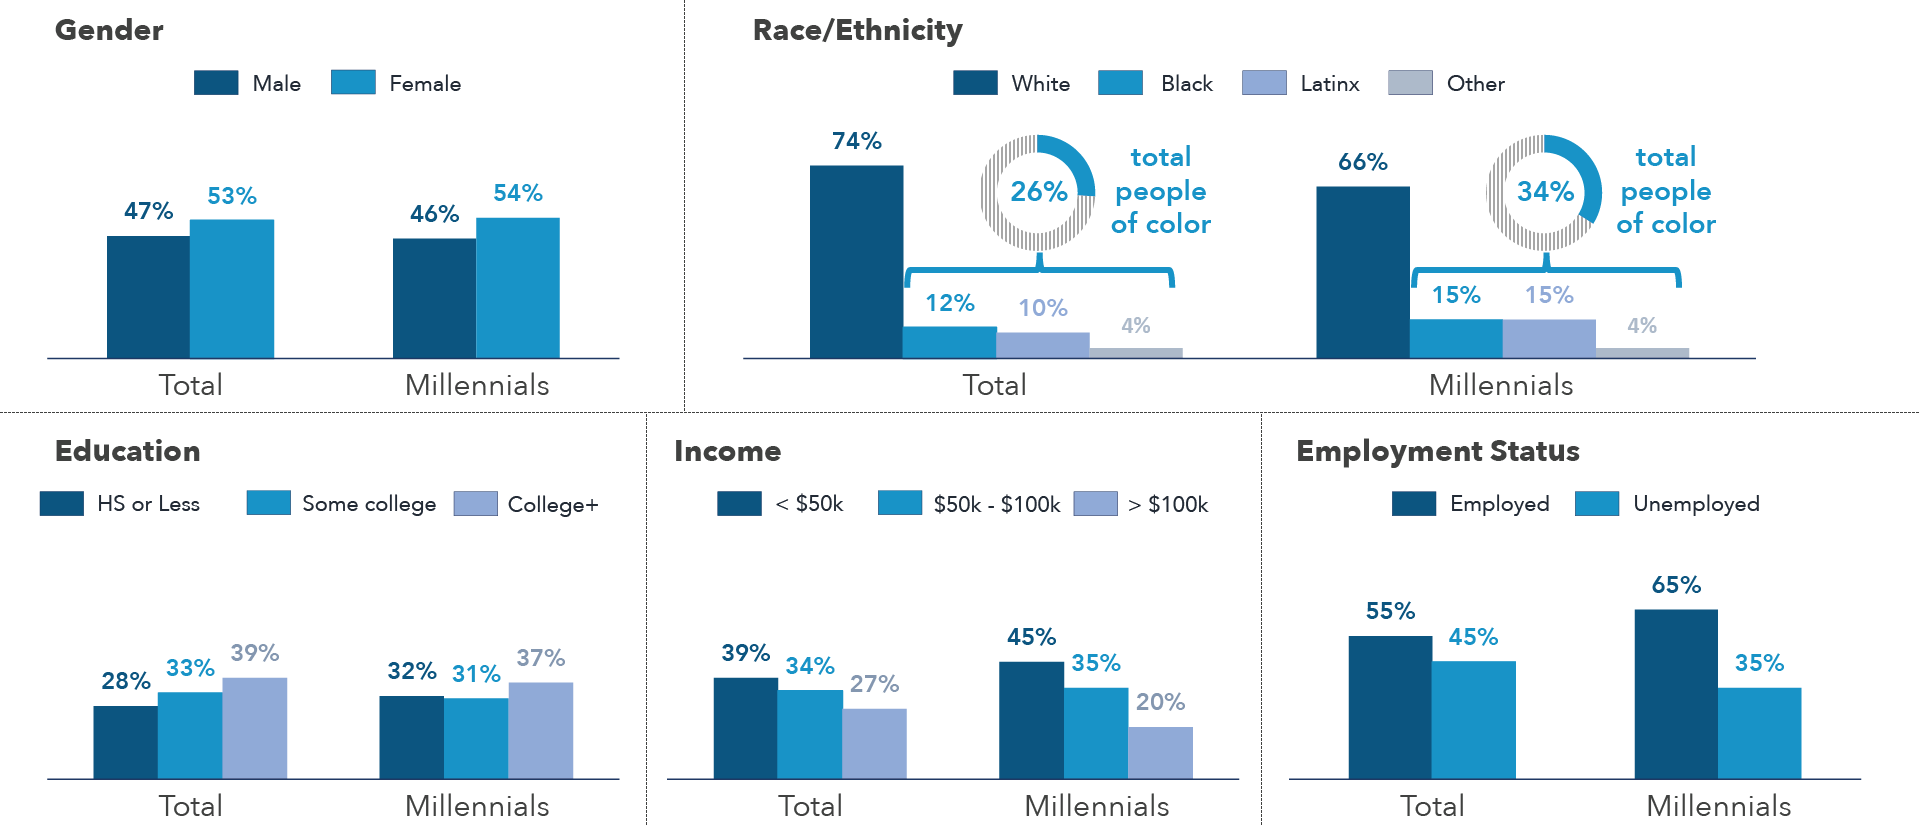
Demographic Profile: More Racially Diverse, Similar in Most Other Ways
Political Profile: More liberal/Democratic-leaning; lower-likelihood voters
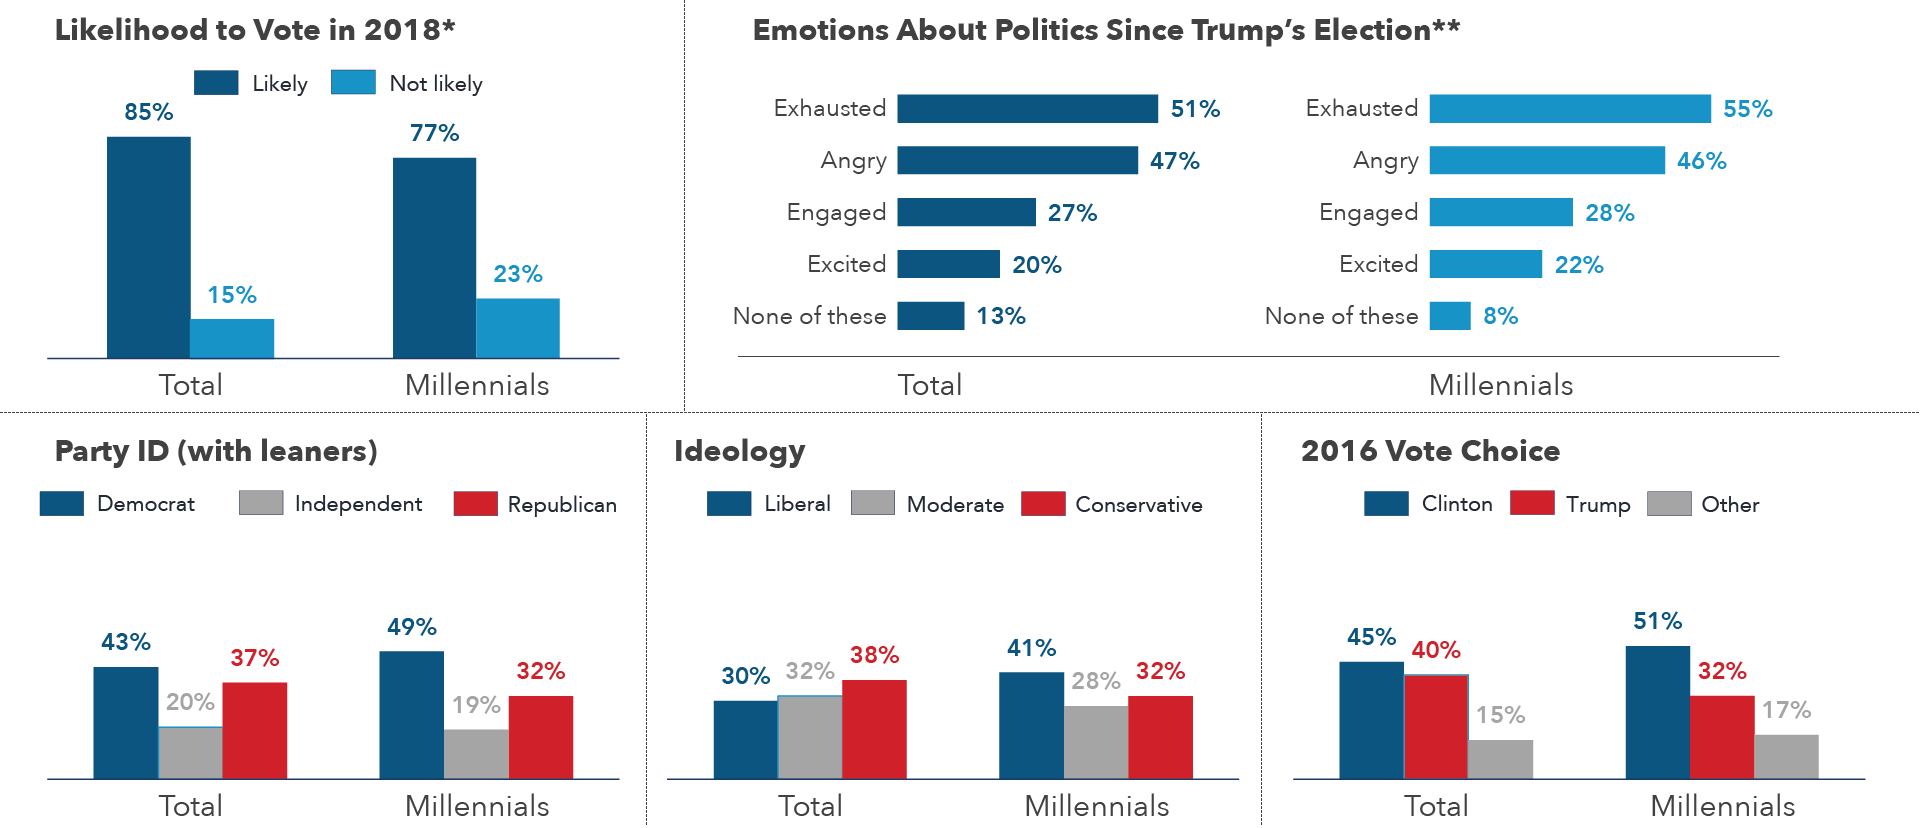
*”Likely” collapses respondents who said definitely or probably. ”Not likely” collapses respondents who said 50/50, probably not, or definitely not.
**Percentages exceed 100 percent because respondents were allowed to select multiple options.
2 | Deep Dive on Millennial Views of Core Metrics & Tracking Over Time
Large gender gap in likelihood to vote in the 2018 midterm elections
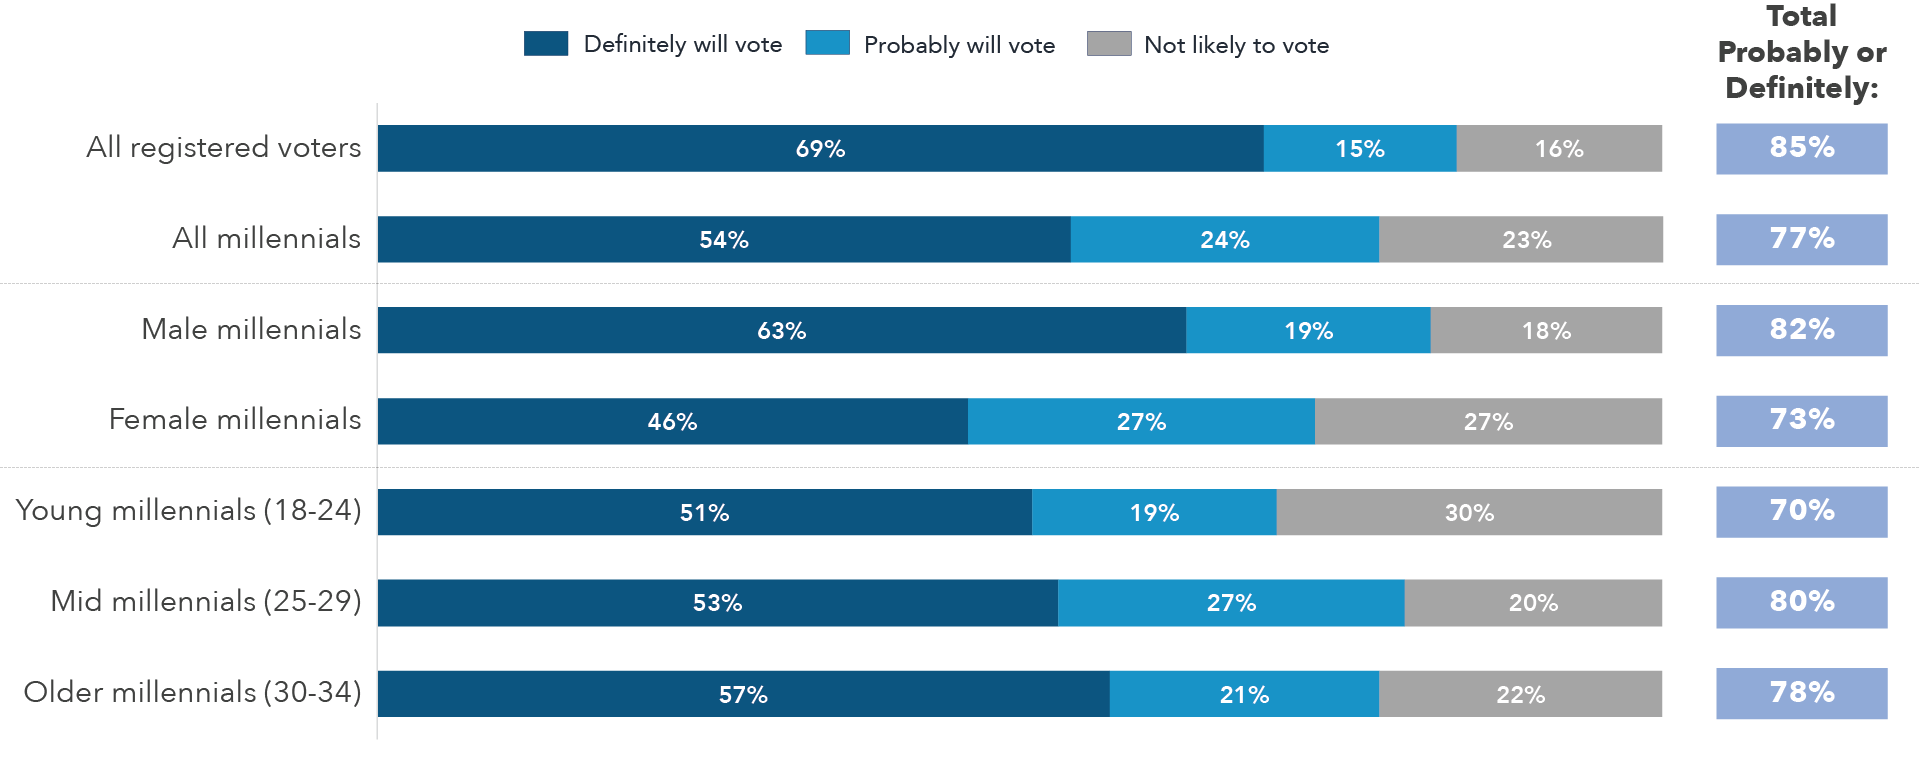
Question wording: ”As you may know, there will be an election for Congress in November of 2018. How likely are you to vote in the November 2018 general election?”
Latinx, Independents are less likely to turn out in 2018
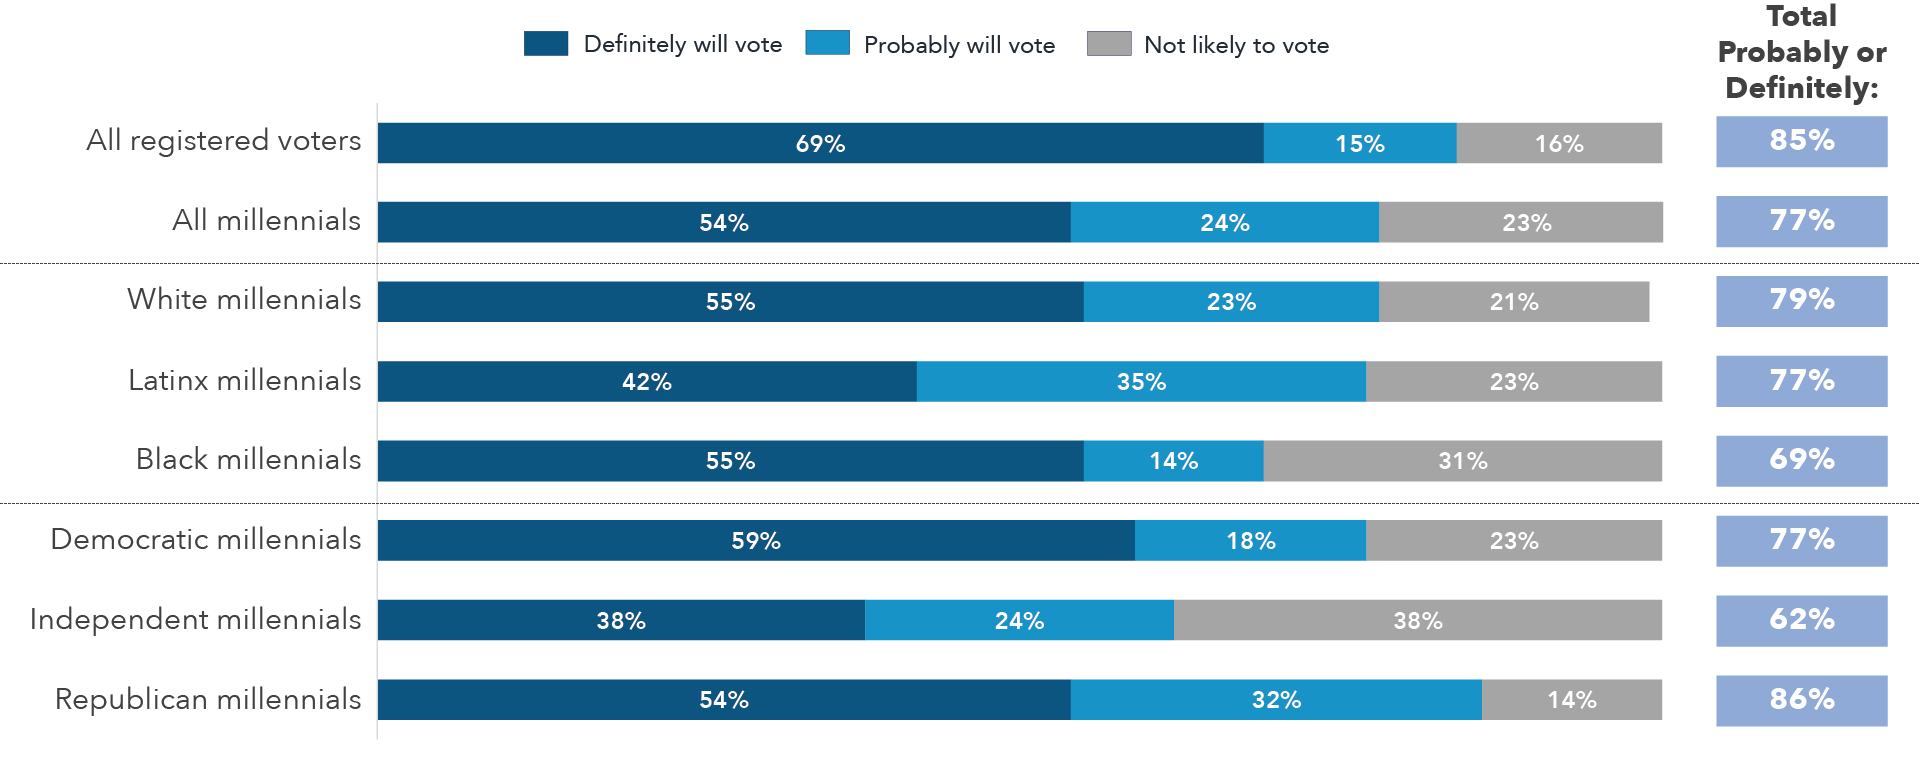
Question wording: ”As you may know, there will be an election for Congress in November of 2018. How likely are you to vote in the November 2018 general election?”
Millennials under-index consistently on self-reported likelihood
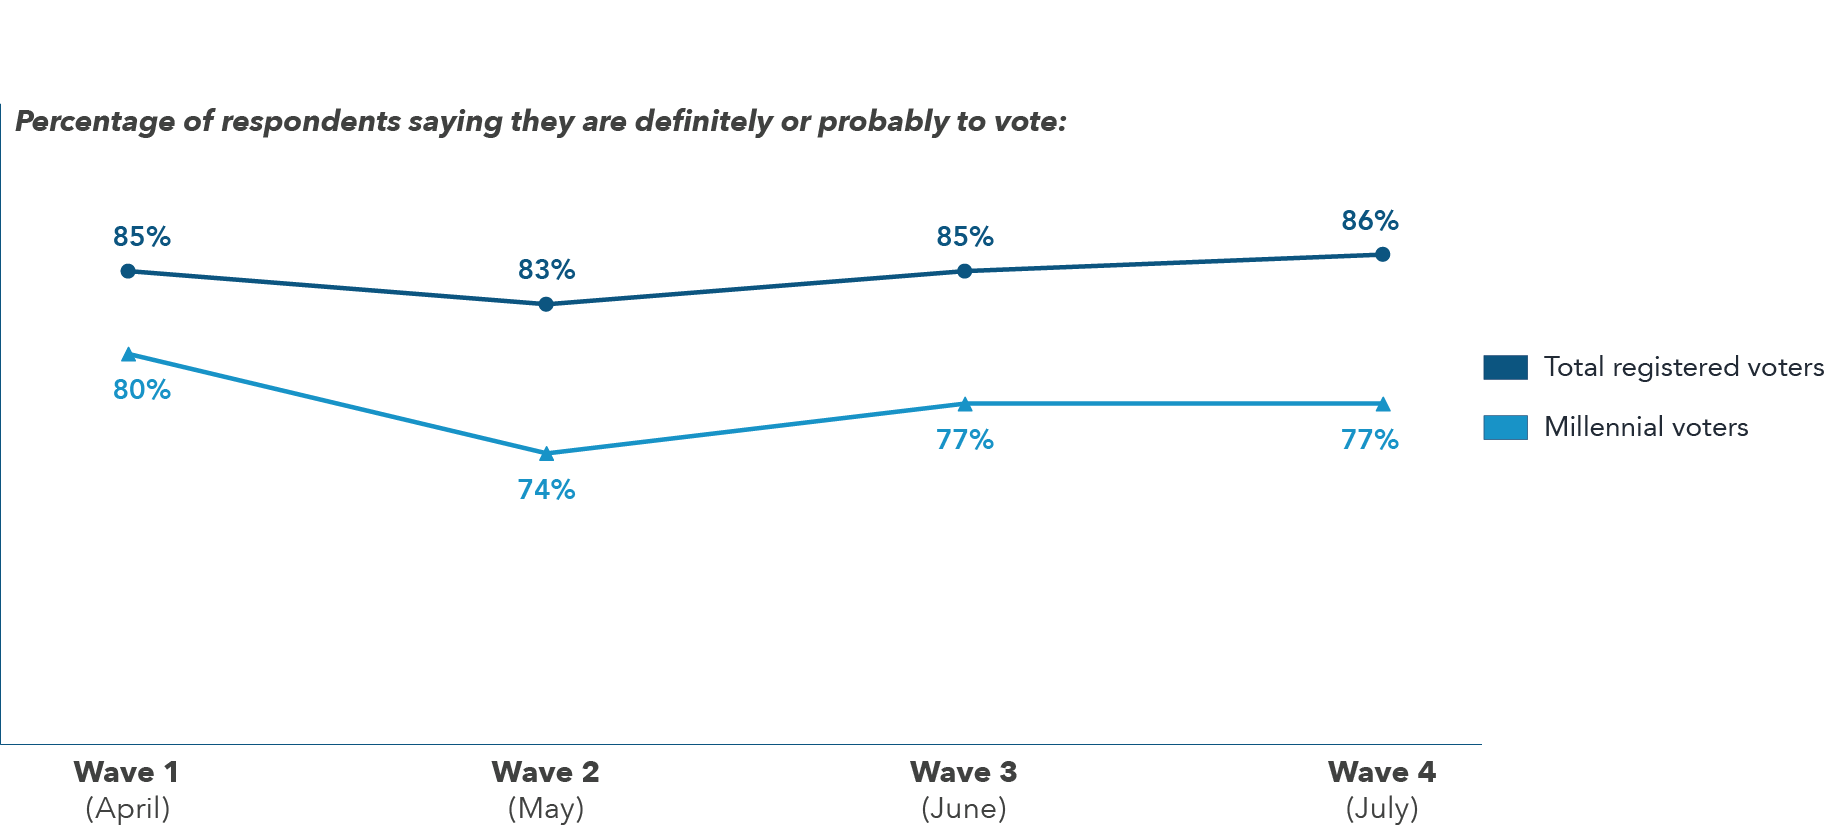
Question wording: ”As you may know, there will be an election for Congress in November of 2018. How likely are you to vote in the November 2018 general election?”
Millennials strongly disapprove of Trump
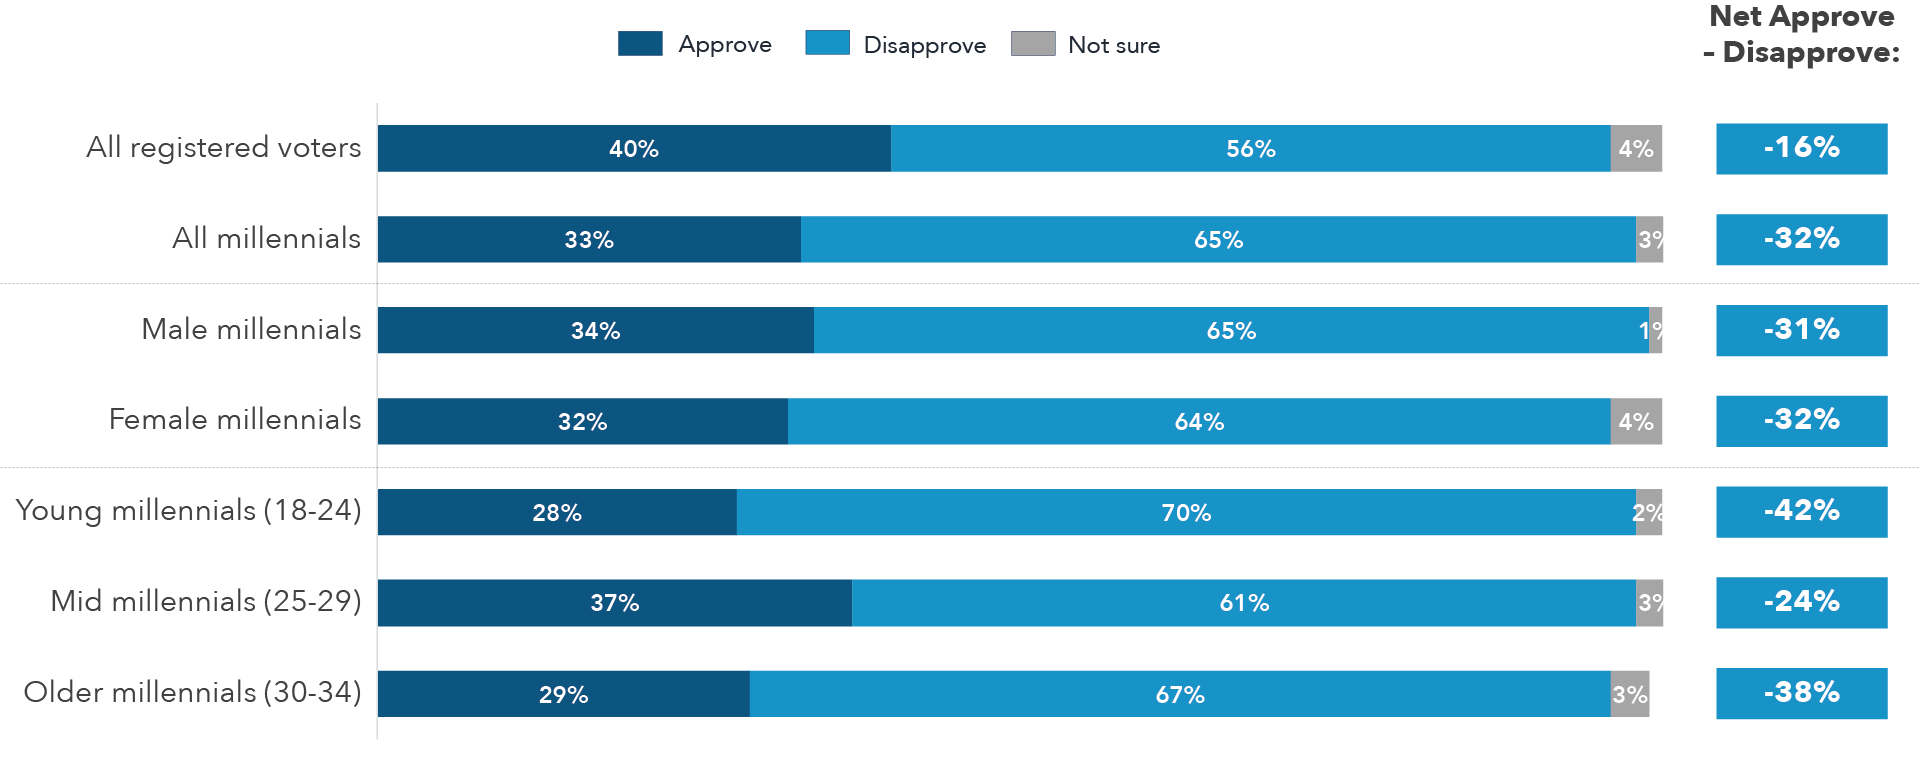
Question wording: ”Do you approve or disapprove of the way Donald Trump is handling his job as president?”
Higher levels of disapproval among voters of color; Independents
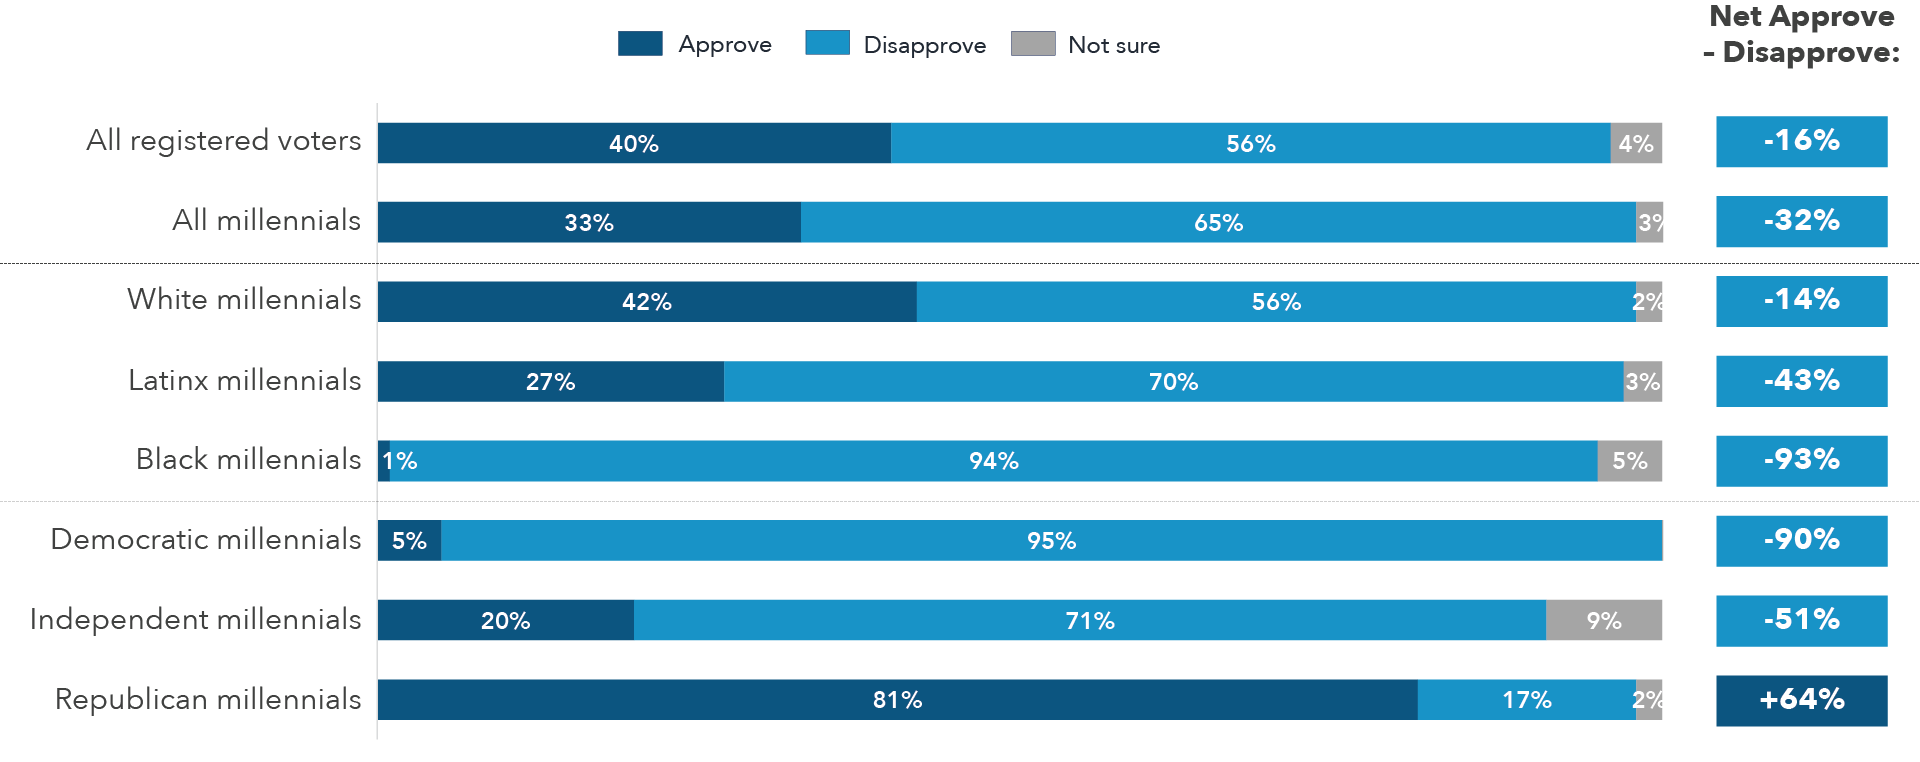
Question wording: ”Do you approve or disapprove of the way Donald Trump is handling his job as president?”
Millennials consistently have lower approval of Trump’s job performance
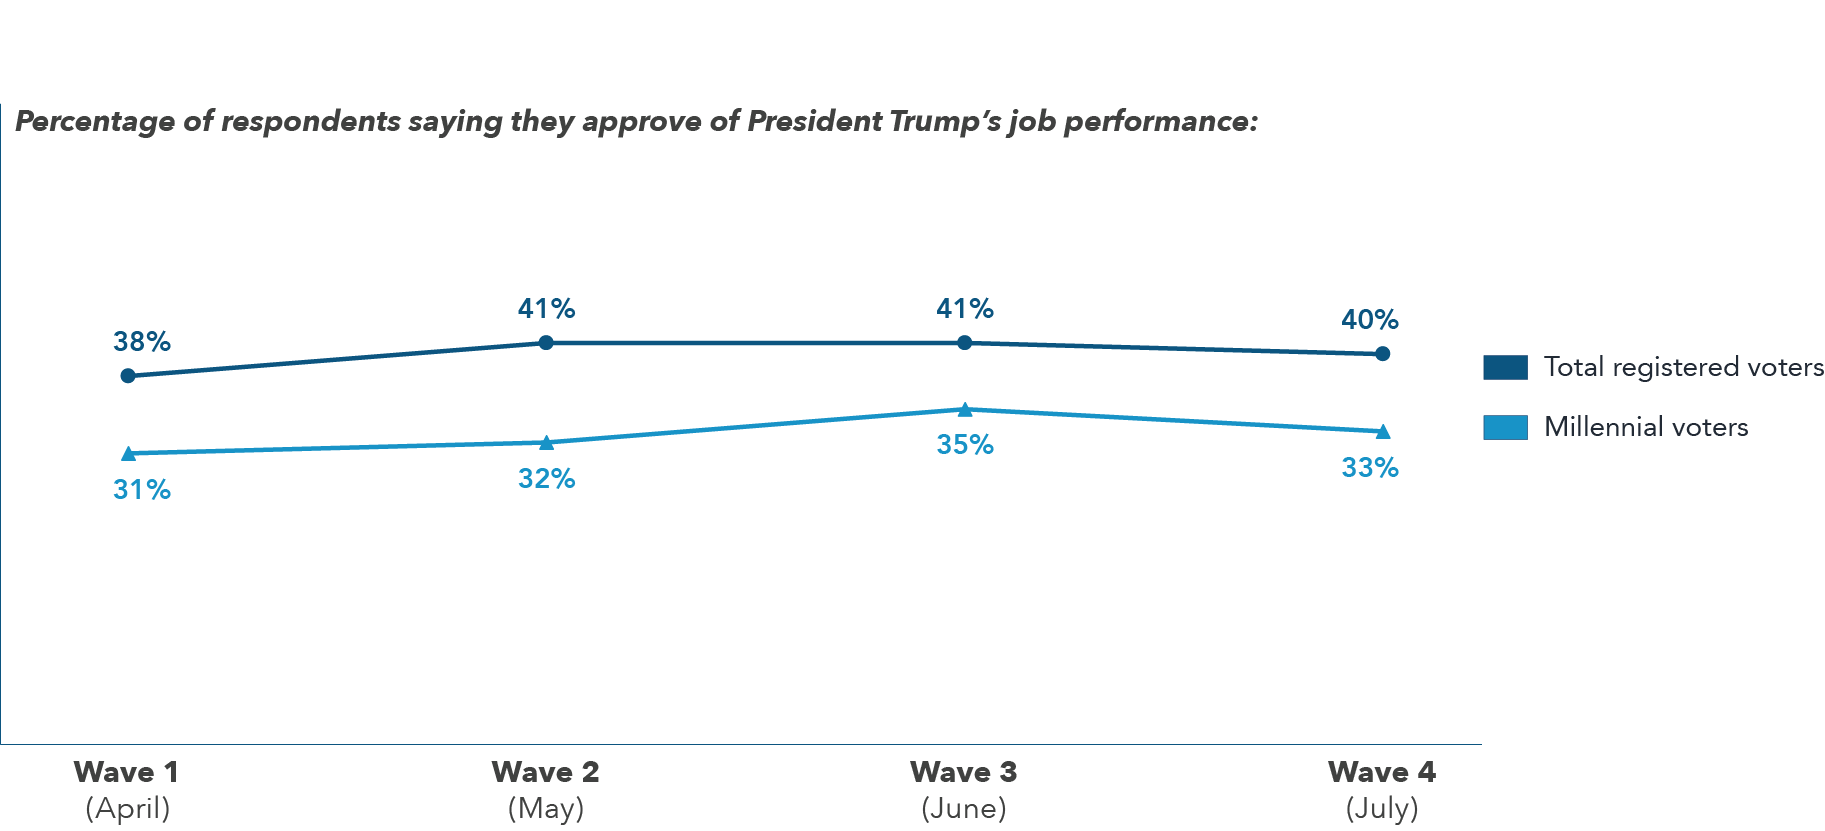
Question wording: ”Do you approve or disapprove of the way Donald Trump is handling his job as president?”
Millennials view Democrats in Congress like the rest of the country
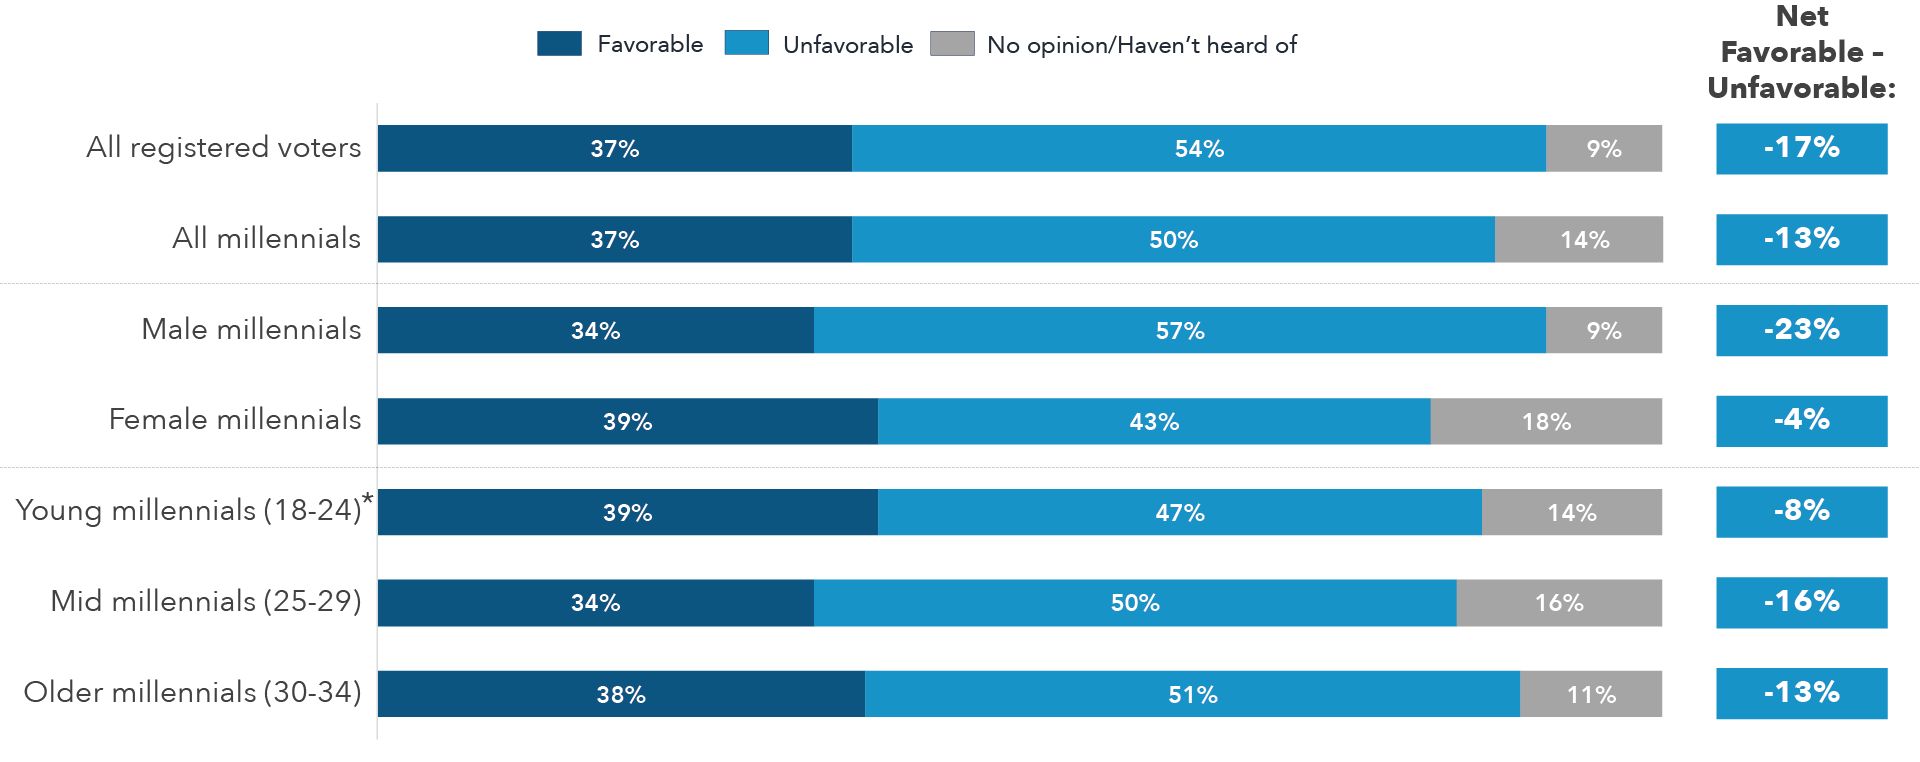
Question wording: ”You will now see the names of some people and institutions. Please indicate how favorable or unfavorable you are to each… Democrats in Congress.”
*Sample size <100; interpret with caution.
Net favorability among voters of color and self-identified Democrats
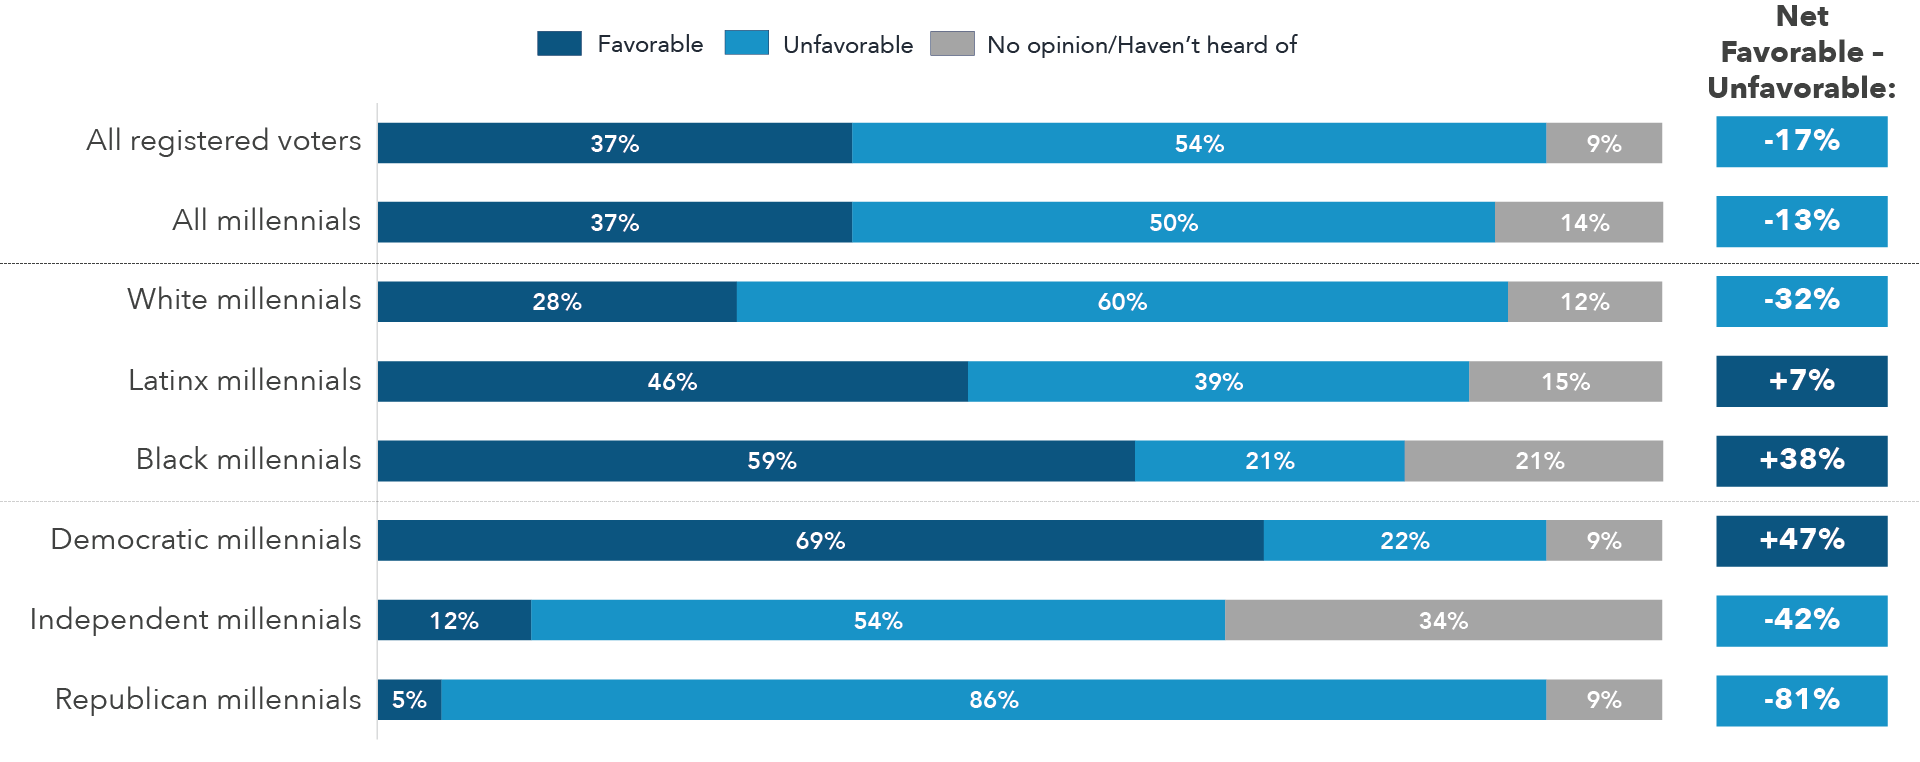
Question wording: ”You will now see the names of some people and institutions. Please indicate how favorable or unfavorable you are to each… Democrats in Congress.”
Millennials more averse to Republicans in Congress across all subgroups
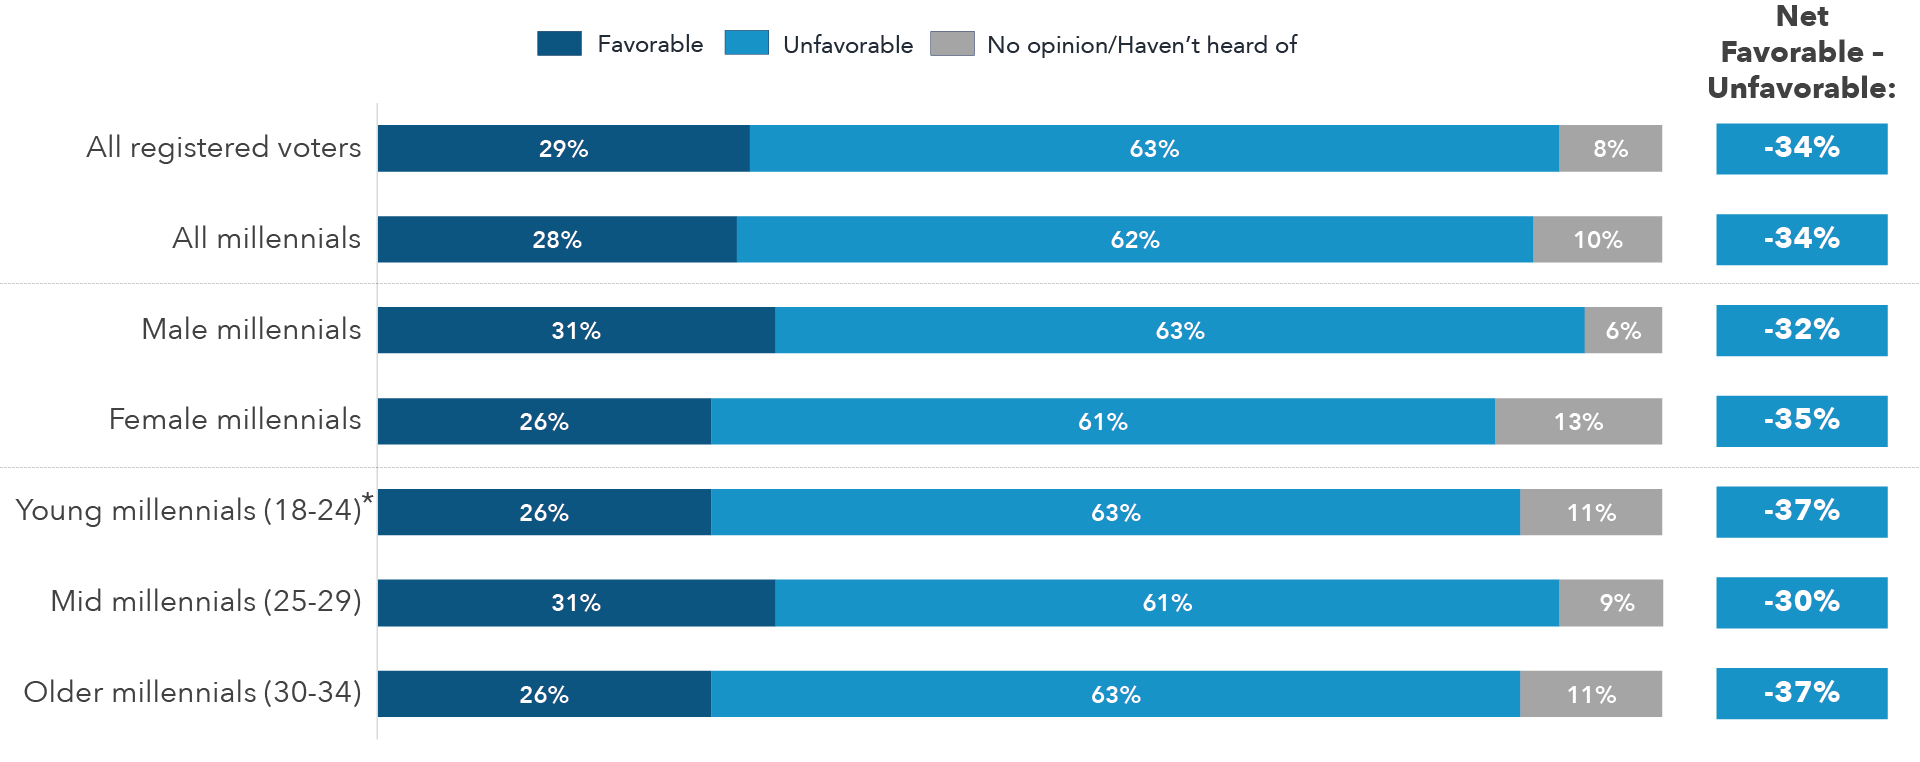
Question wording: ”You will now see the names of some people and institutions. Please indicate how favorable or unfavorable you are to each… Republicans in Congress.”
*Sample size <100; interpret with caution.
Only Republican millennials favorable toward Republicans in Congress
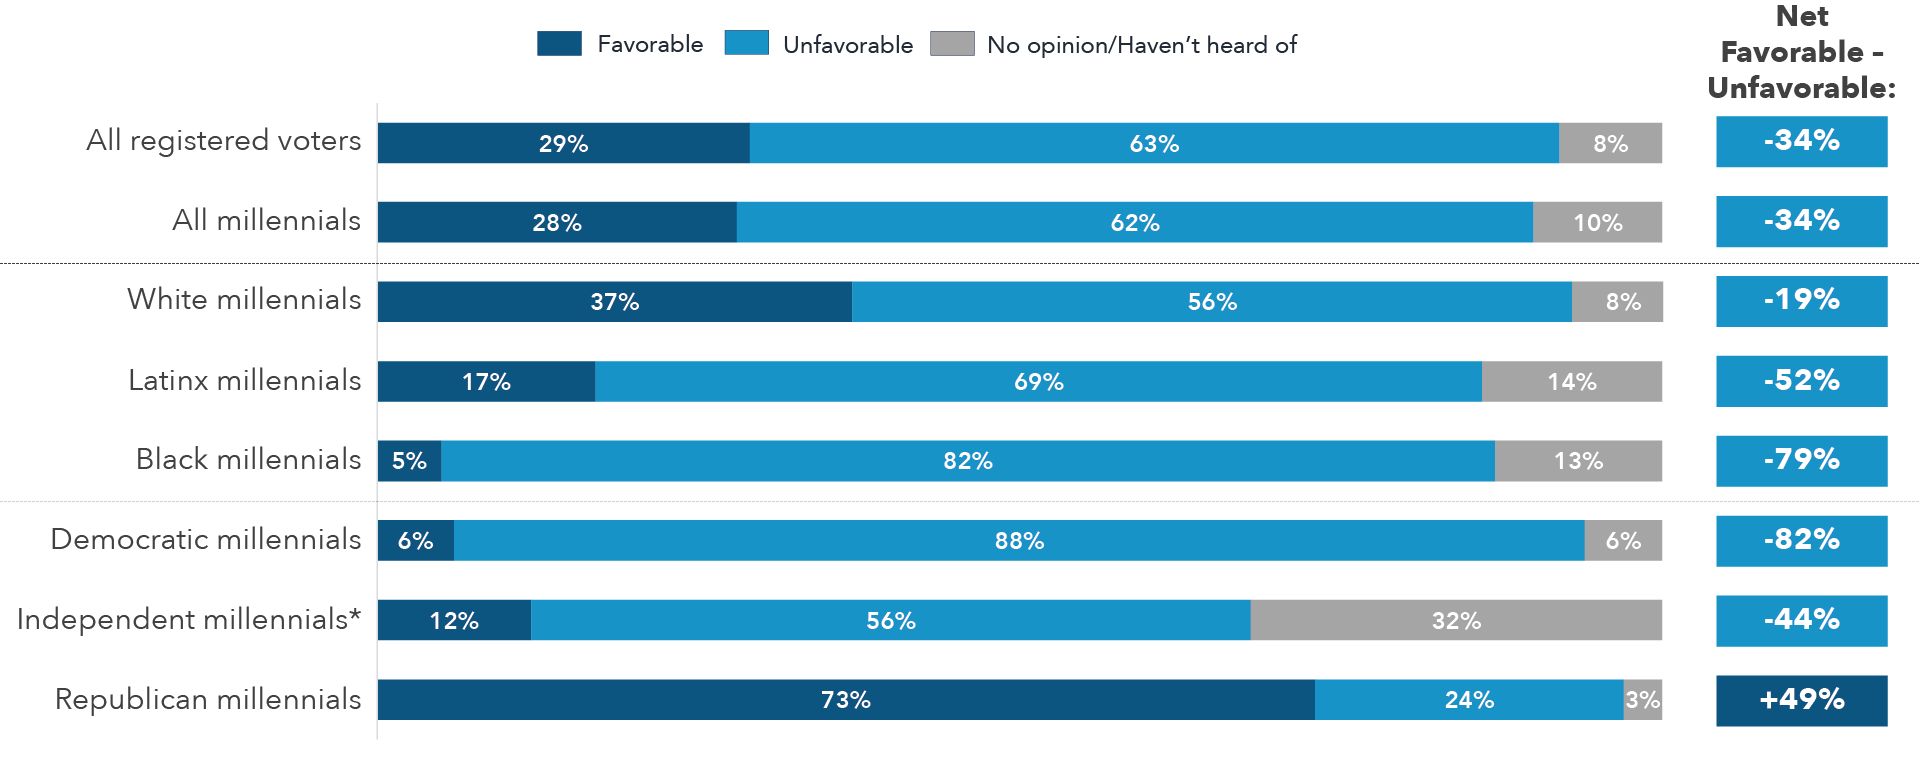
Question wording: ”You will now see the names of some people and institutions. Please indicate how favorable or unfavorable you are to each… Republicans in Congress.”
*Sample size <100; interpret with caution.
Evaluations of Trump’s character largely track with job approval ratings
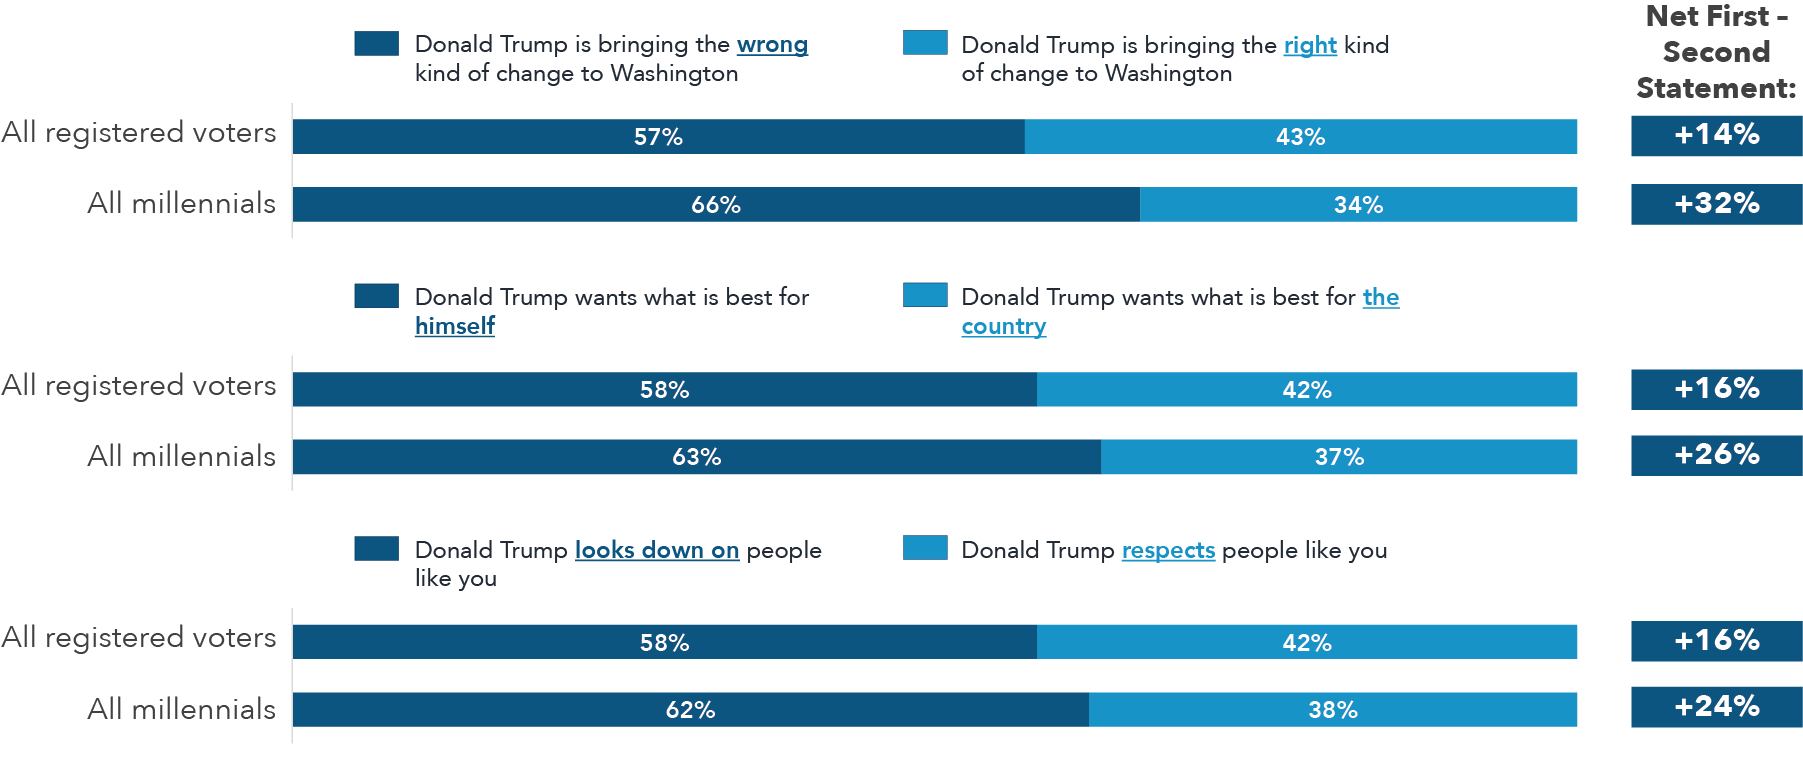
Question wording: ”Now you will read some pairs of statements about Donald Trump. For each pair, indicate which you agree with more.”
3 | Highlights Among Millennials from Navigator Focus Areas
The Special Counsel Investigation
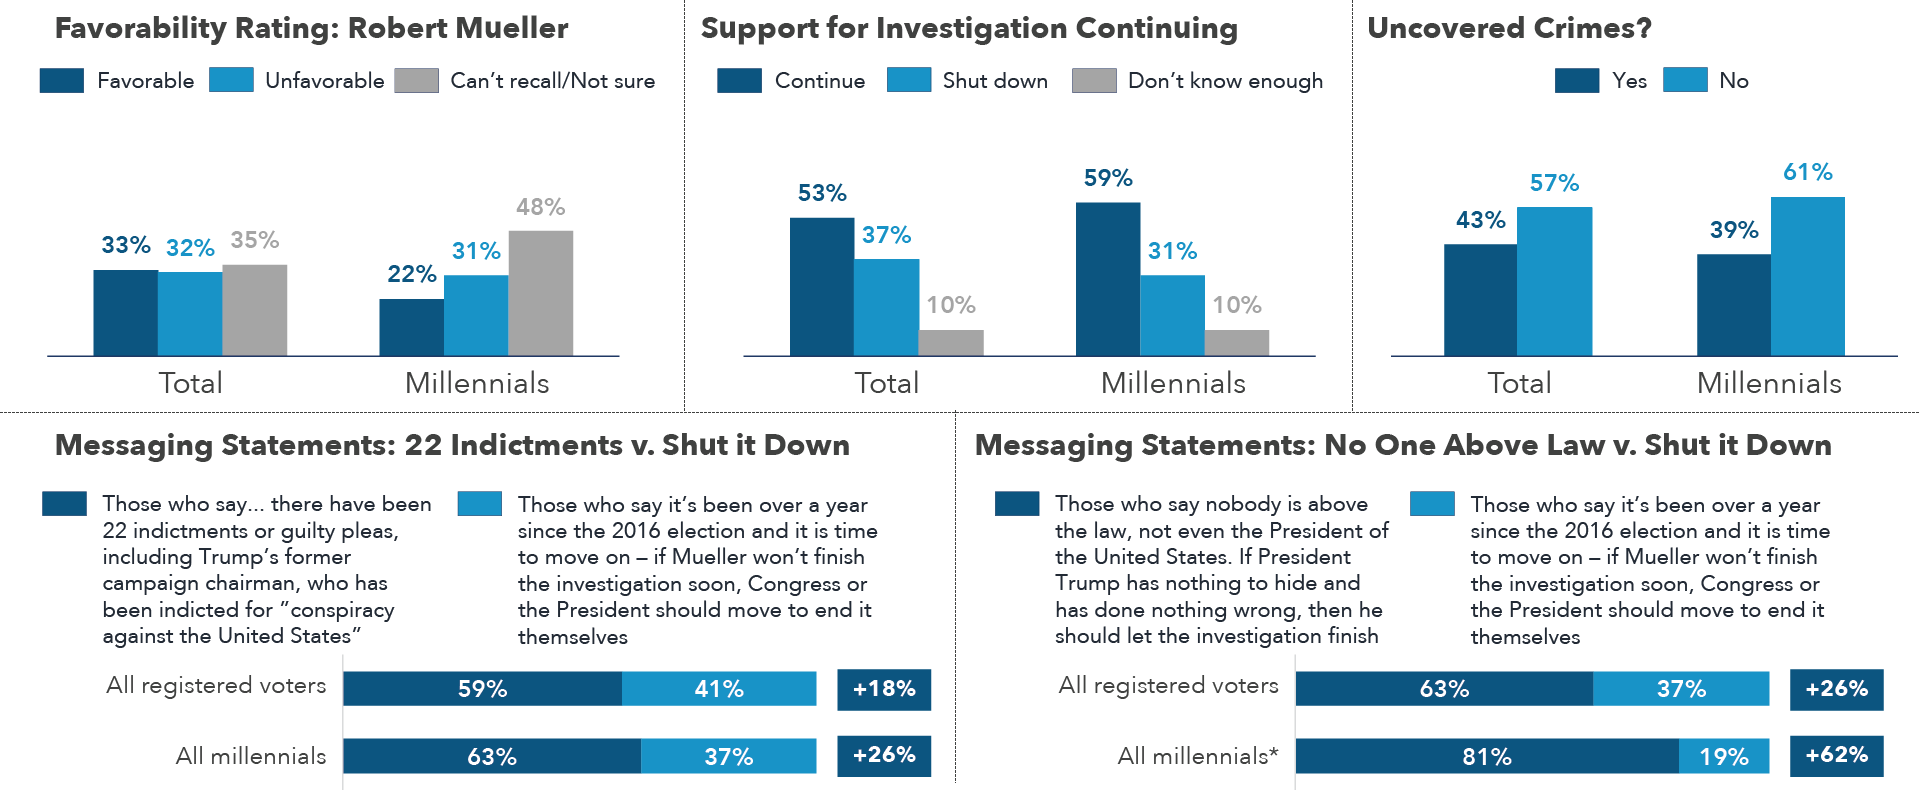
Question wordings: ”Please indicate how favorable or unfavorable you are to each… Robert Mueller.” / “Which of the following best describes your feelings about this investigation?” / “To the best of your knowledge, has the investigation uncovered any crimes?” / “Whom do you agree with more?”
*Sample size <100; interpret with caution.
Enthusiasm & Engagement with Politics
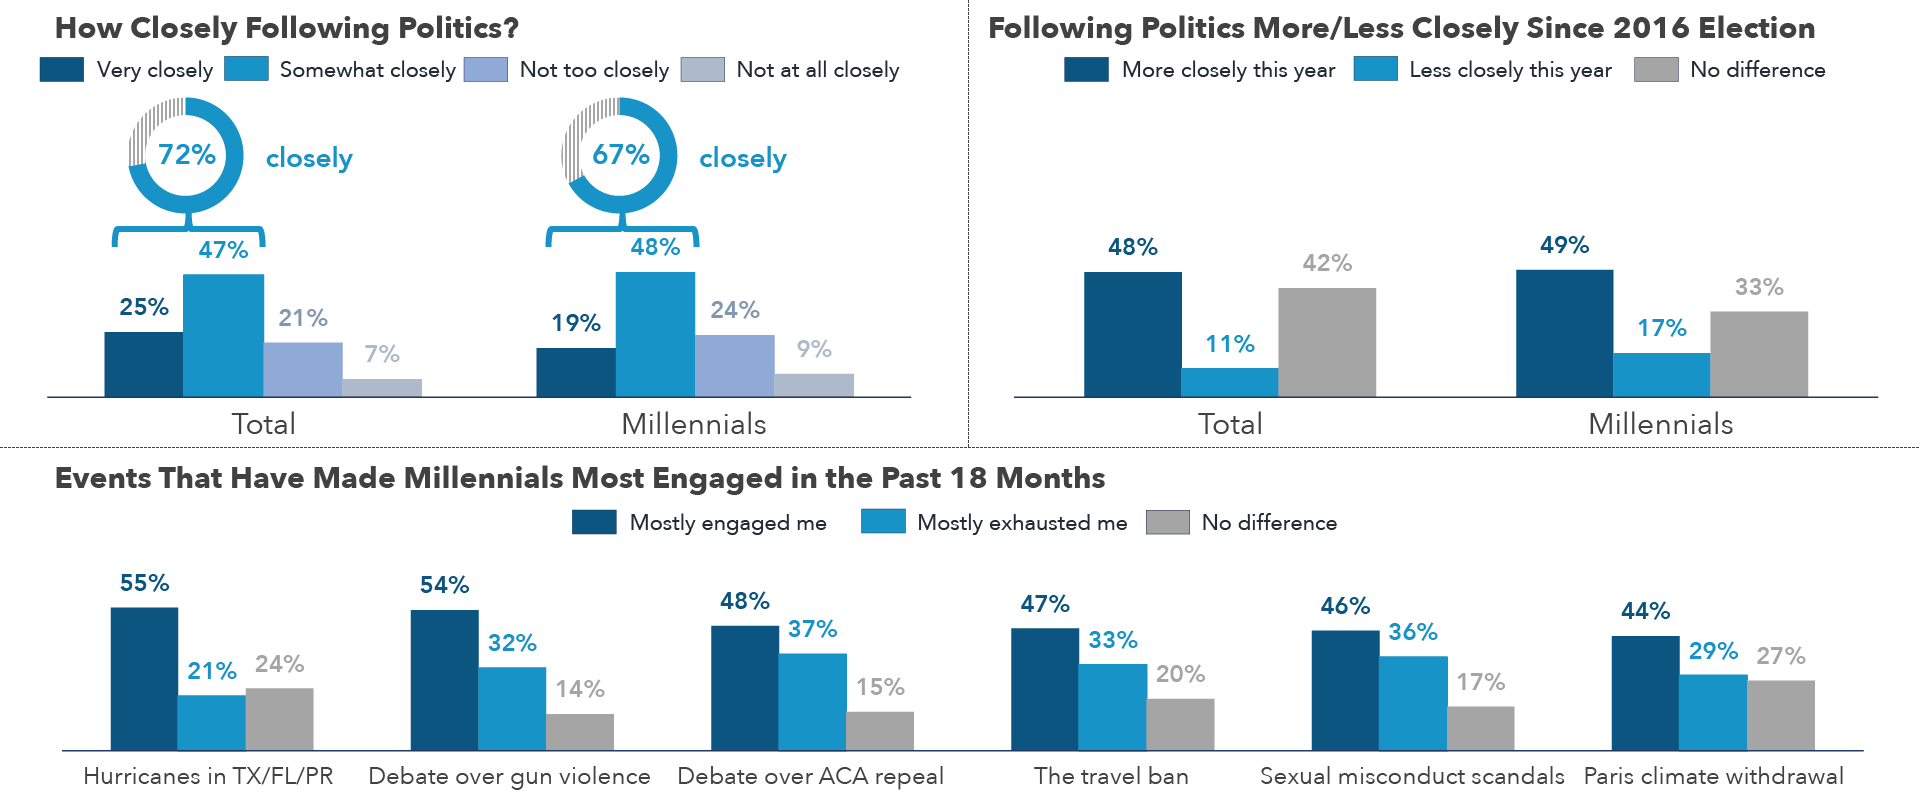
Question wordings: ”In general, how closely do you follow politics and elections?” / “Since Trump was elected, do you find you are following national politics more closely, less closely, or is there no difference?” / “For each [issue or event], please indicate whether hearing about it has mostly engaged or exhausted you.”
Politics of Rising Costs of Health Care
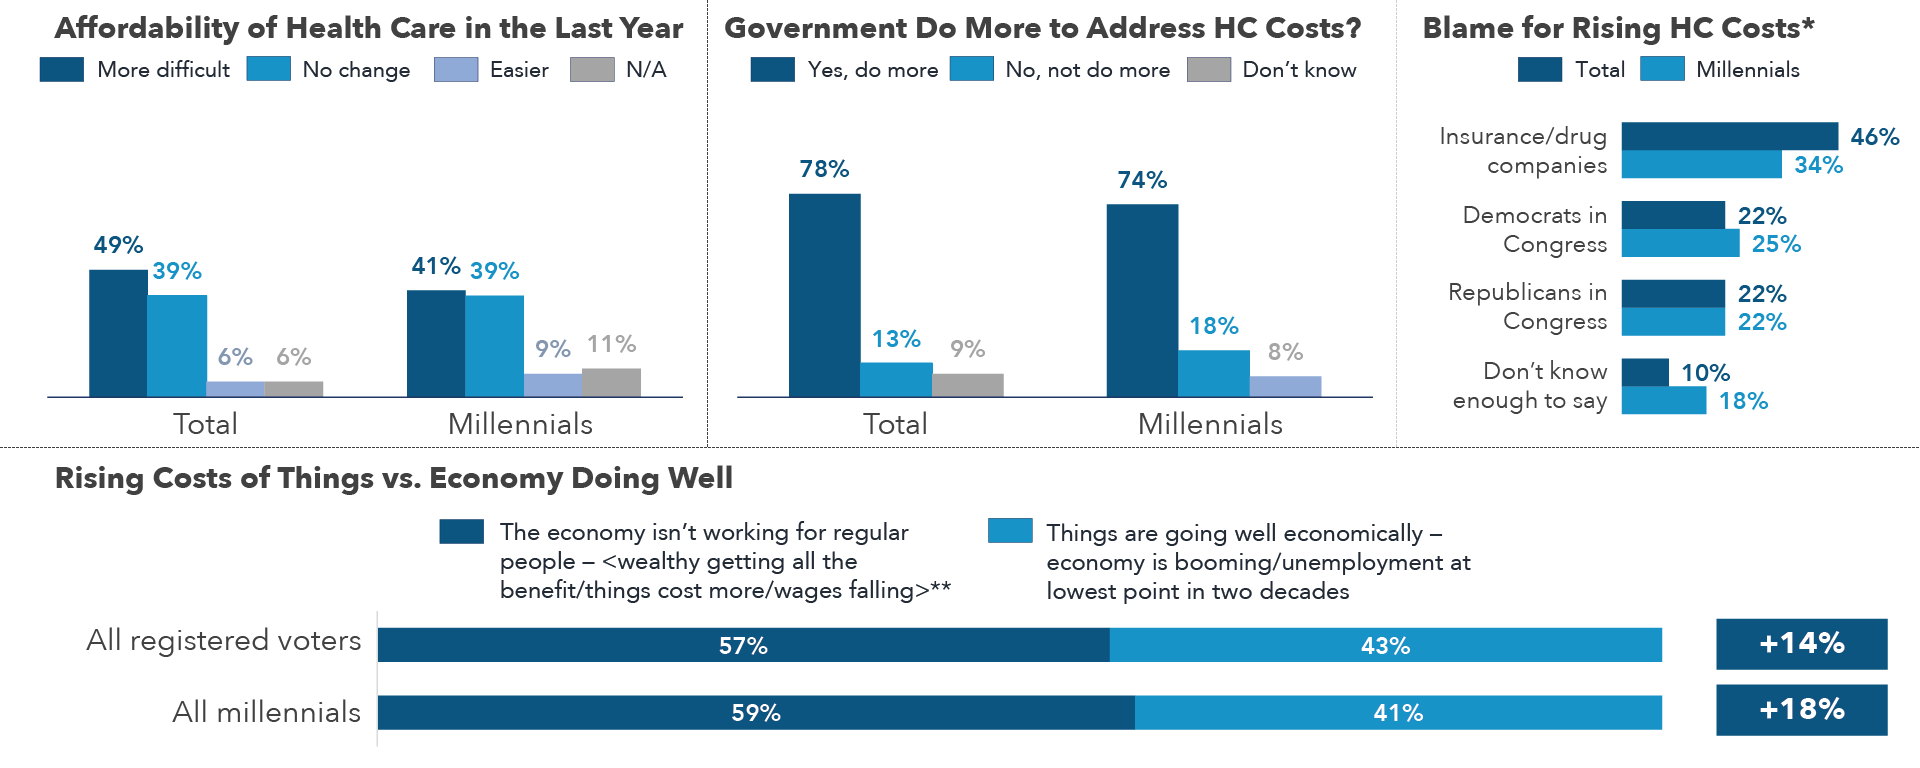
Question wordings: ”Please indicate whether you, personally, are finding it to afford since last year, or has there been no change?” “Please indicate whether the government should be doing more to make each one affordable, or not.” / “Which of the following statements do you agree with more?”
*Percentages exceed 100 percent because respondents were allowed to select multiple options;
**Multiple messages were combined to ensure a sufficient sample size for analysis.
Congressional Accountability for Sexual Misconduct
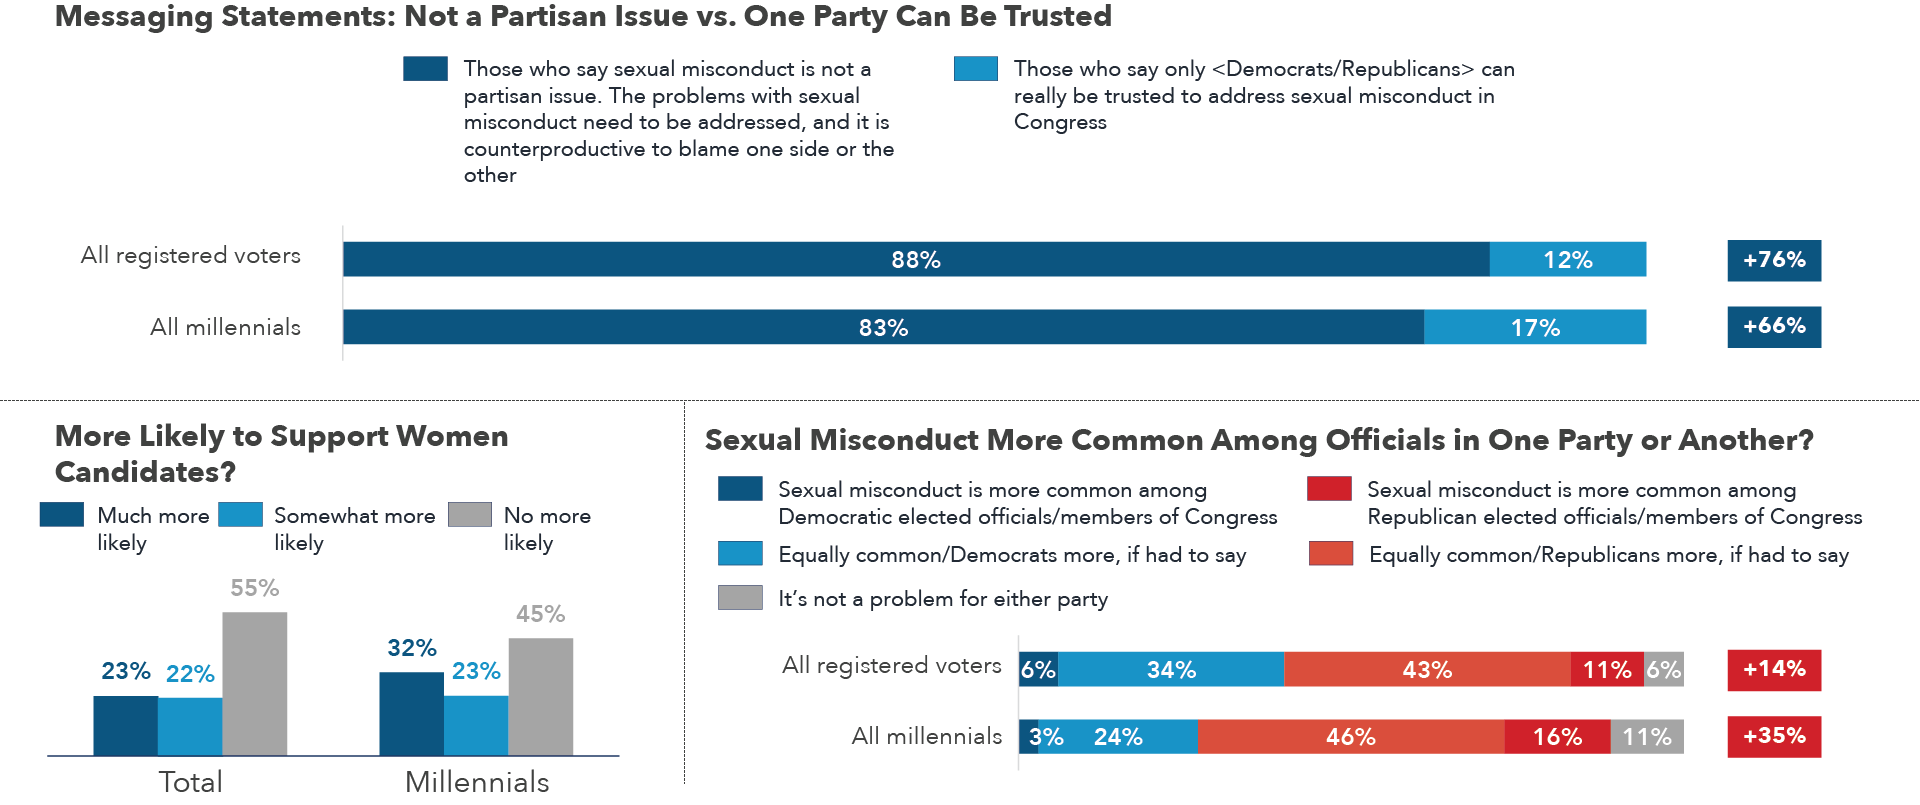
Question wordings: ”Please indicate how favorable or unfavorable you are to each… The Me Too Movement.” / Whom do you agree with more?” / “How much more likely, if at all, are you to support women candidates running for offices following recent stories about sexual misconduct among elected officials?”
National Security and “America First”
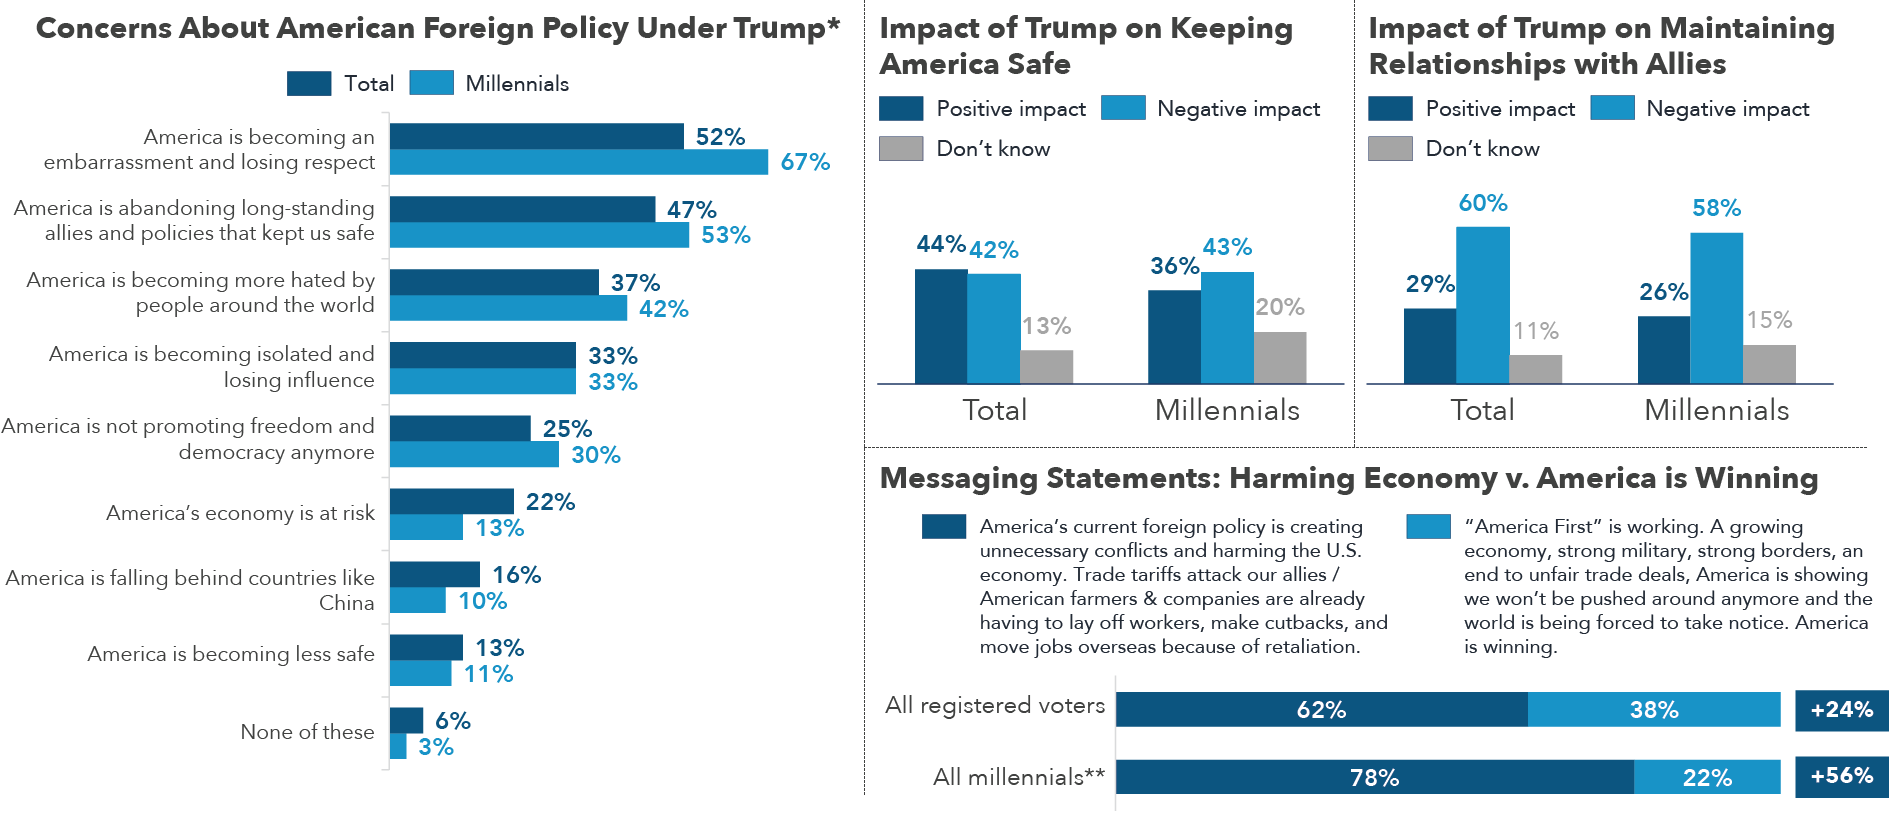
Question wordings: ”Which of the following words best describes your concerns [about how American foreign policy is changing under Trump]?” / “Compared to past presidents, do you think President Trump is having a positive or negative impact in the following areas?” / “Which statement do you agree with more?”
*Percentages exceed 100 percent because respondents were allowed to select multiple options; **Sample size <100; interpret with caution.

