Poll: Rating Democratic & Republican Lawmakers
This Navigator Research report contains polling data comparing perceptions of Democratic and Republican lawmakers in closely divided House districts. We look at impressions of incumbent lawmakers such as favorability, general job approval, economic job approval, and priorities.
Democratic lawmakers outperform Republicans in the battleground in several key ways.
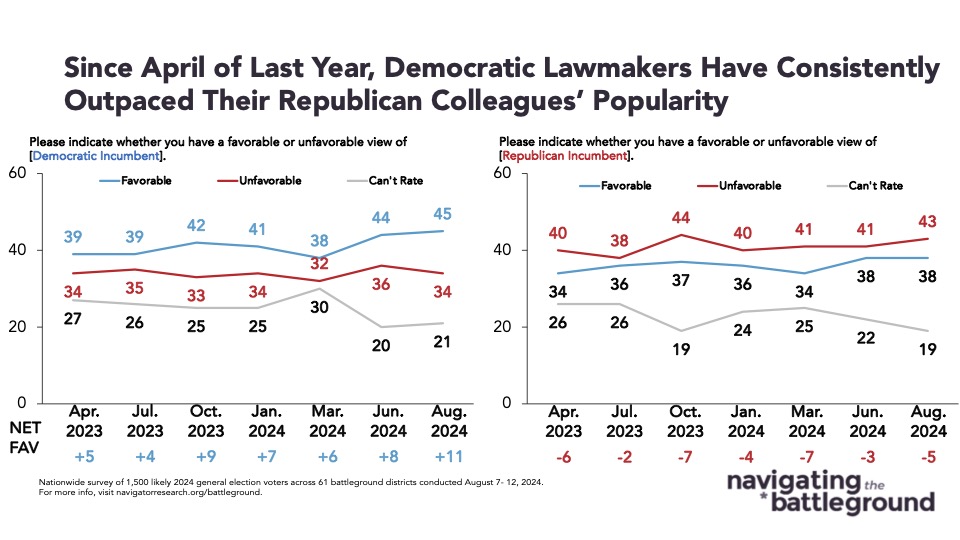
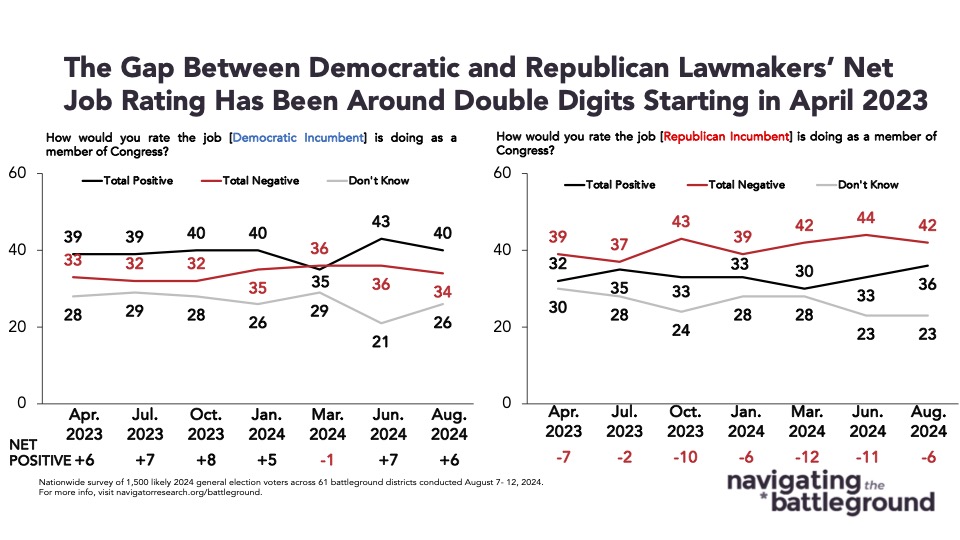
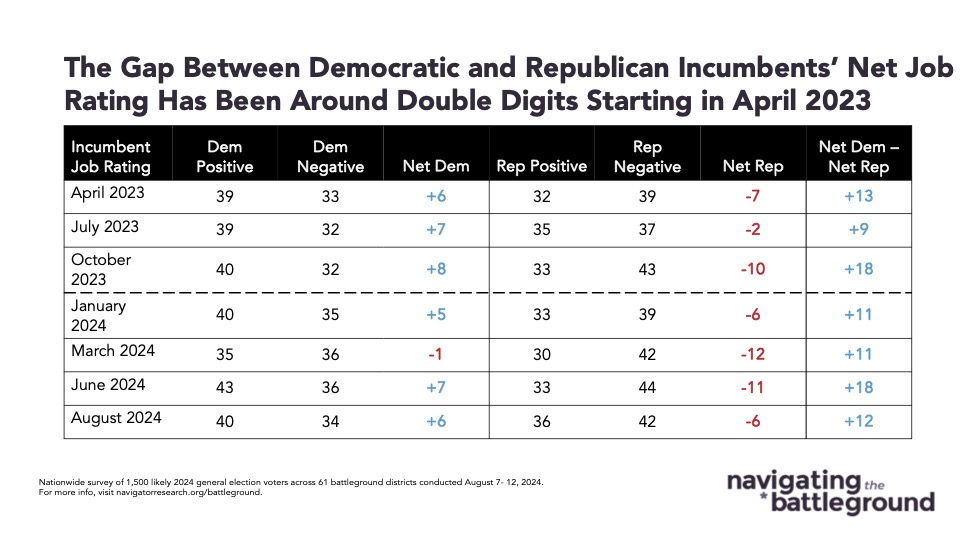
Since April of last year, Democratic lawmakers have consistently outpaced Republicans lawmakers favorability and job approval. Democratic lawmakers in battleground districts are viewed favorably by their constituents by an 11-point margin (45 percent favorable – 34 percent unfavorable), a margin 5-points wider than March of this year (38 percent favorable – 32 percent unfavorable), while Republican lawmakers are underwater with their constituents by a 5-point margin (38 percent unfavorable – 43 percent favorable). Similarly, Democratic lawmakers in battleground districts earn positive job ratings from their constituents (net +6; 40 percent positive – 34 percent negative), while the job rating of Republican lawmakers is net-negative by 6-points (36 percent positive – 42 percent negative).
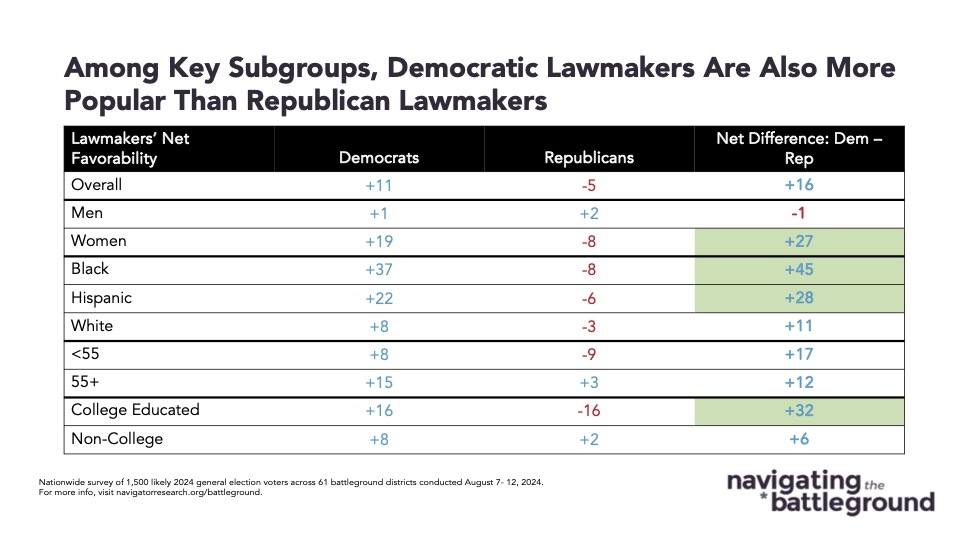
Democratic lawmakers are rated significantly more favorably than Republican lawmakers by women (net +19 Democratic favorability – net -8 Republican favorability), Black Americans (net +37 Democratic favorability – net -8 Republican favorability), and Hispanic Americans (net +22 Democratic favorability – net -6 Republican favorability).
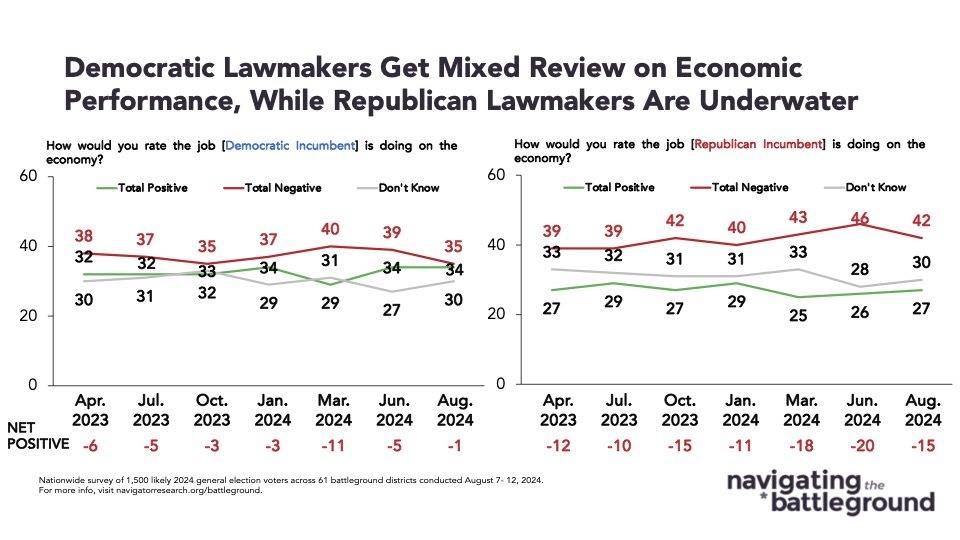
Battleground constituents continue to give their Republican lawmakers negative job ratings on their handling of the economy, while Democratic lawmakers break even.
Battleground constituents rate the job of their Republican lawmakers on the economy negatively by double digit margins (net -15; 27 percent positive – 42 percent negative), and have since April of 2023 (net -12; 27 percent positive – 39 percent negative). Democratic lawmakers are currently experiencing their most positive job rating on the economy since April of 2023 (net -6; 32 percent positive – 38 percent negative), with battleground constituents now split on how they rate their job on the economy (net -1; 34 percent positive – 35 percent negative).
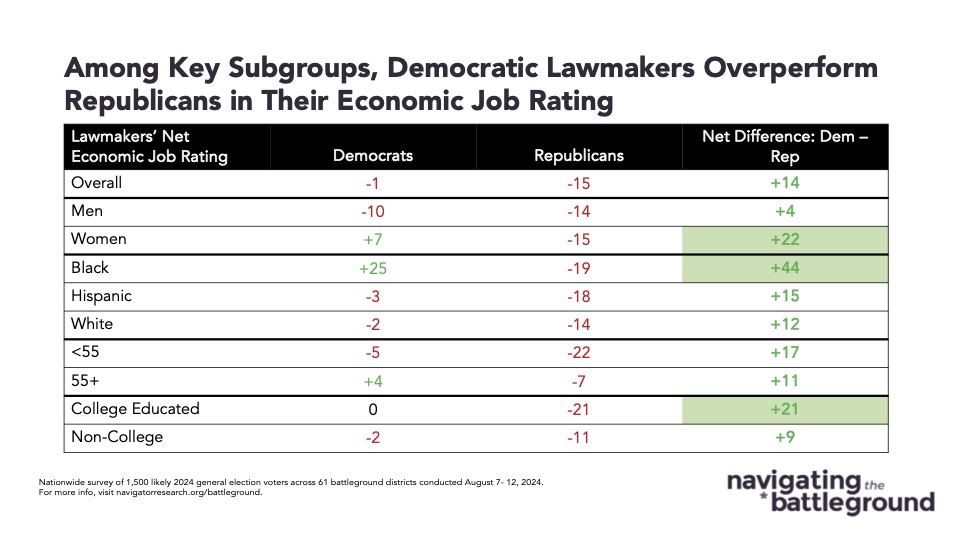
Republican lawmakers receive net-negative economic job ratings across demographic groups, while Democratic lawmakers receive positive economic job ratings from women (net +7; 38 percent positive – 31 percent negative), Black Americans (net +25; 43 percent positive – 18 percent negative), and Americans over the age of 55 (net +4; 38 percent positive – 34 percent negative).
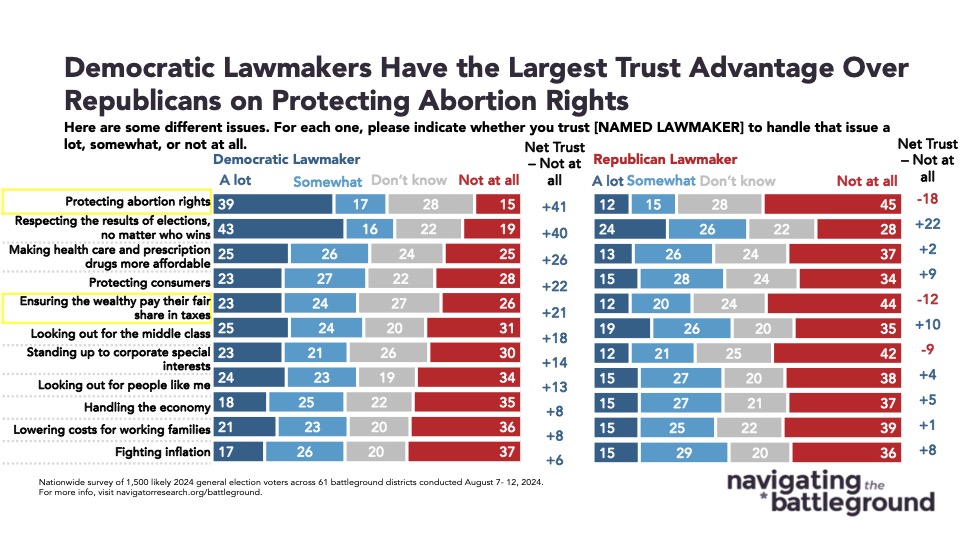
Democratic lawmakers have the largest trust advantage over Republicans on protecting abortion rights and ensuring the wealthy pay their fair share.
Battleground constituents trust Democratic lawmakers to protect abortion by a 41-point margin (56 percent trust – 15 percent do not trust), while trust in their Republican lawmakers to protect abortion rights is upside down by 18-points (27 percent trust – 45 percent do not trust). Battleground constituents also trust their Democratic lawmakers by a 21-point margin to ensure the wealthy pay their fair share in taxes (47 percent trust – 26 percent do not trust), while trust in Republican lawmakers to ensure the wealthy pay their fair share is underwater by 12-points (32 percent trust – 44 percent do not trust).
On other issues, the differences in trust between the parties is more narrow. While Democratic lawmakers earn a net trust score 3 points greater than Republican lawmakers when it comes to handling the economy (Democratic lawmakers net +8; 43 percent trust – 35 percent do not trust, Republican lawmakers net +5; 42 percent trust – 37 percent do not trust), Republican lawmakers have a 2-point trust net trust advantage when it comes to fighting inflation (Republican lawmakers net +8; 44 percent trust – 36 percent do not trust, Democratic lawmakers net +6; 43 percent trust – 37 percent do not trust).

