Poll: Economic Indicators
This Navigator Research report contains polling data on the latest perceptions of the economy, including how Americans feel about the overall state of the economy and their personal financial situations, what indicators people use to assess the state of the economy, and how inflation has impacted consumer behavior over the past year.
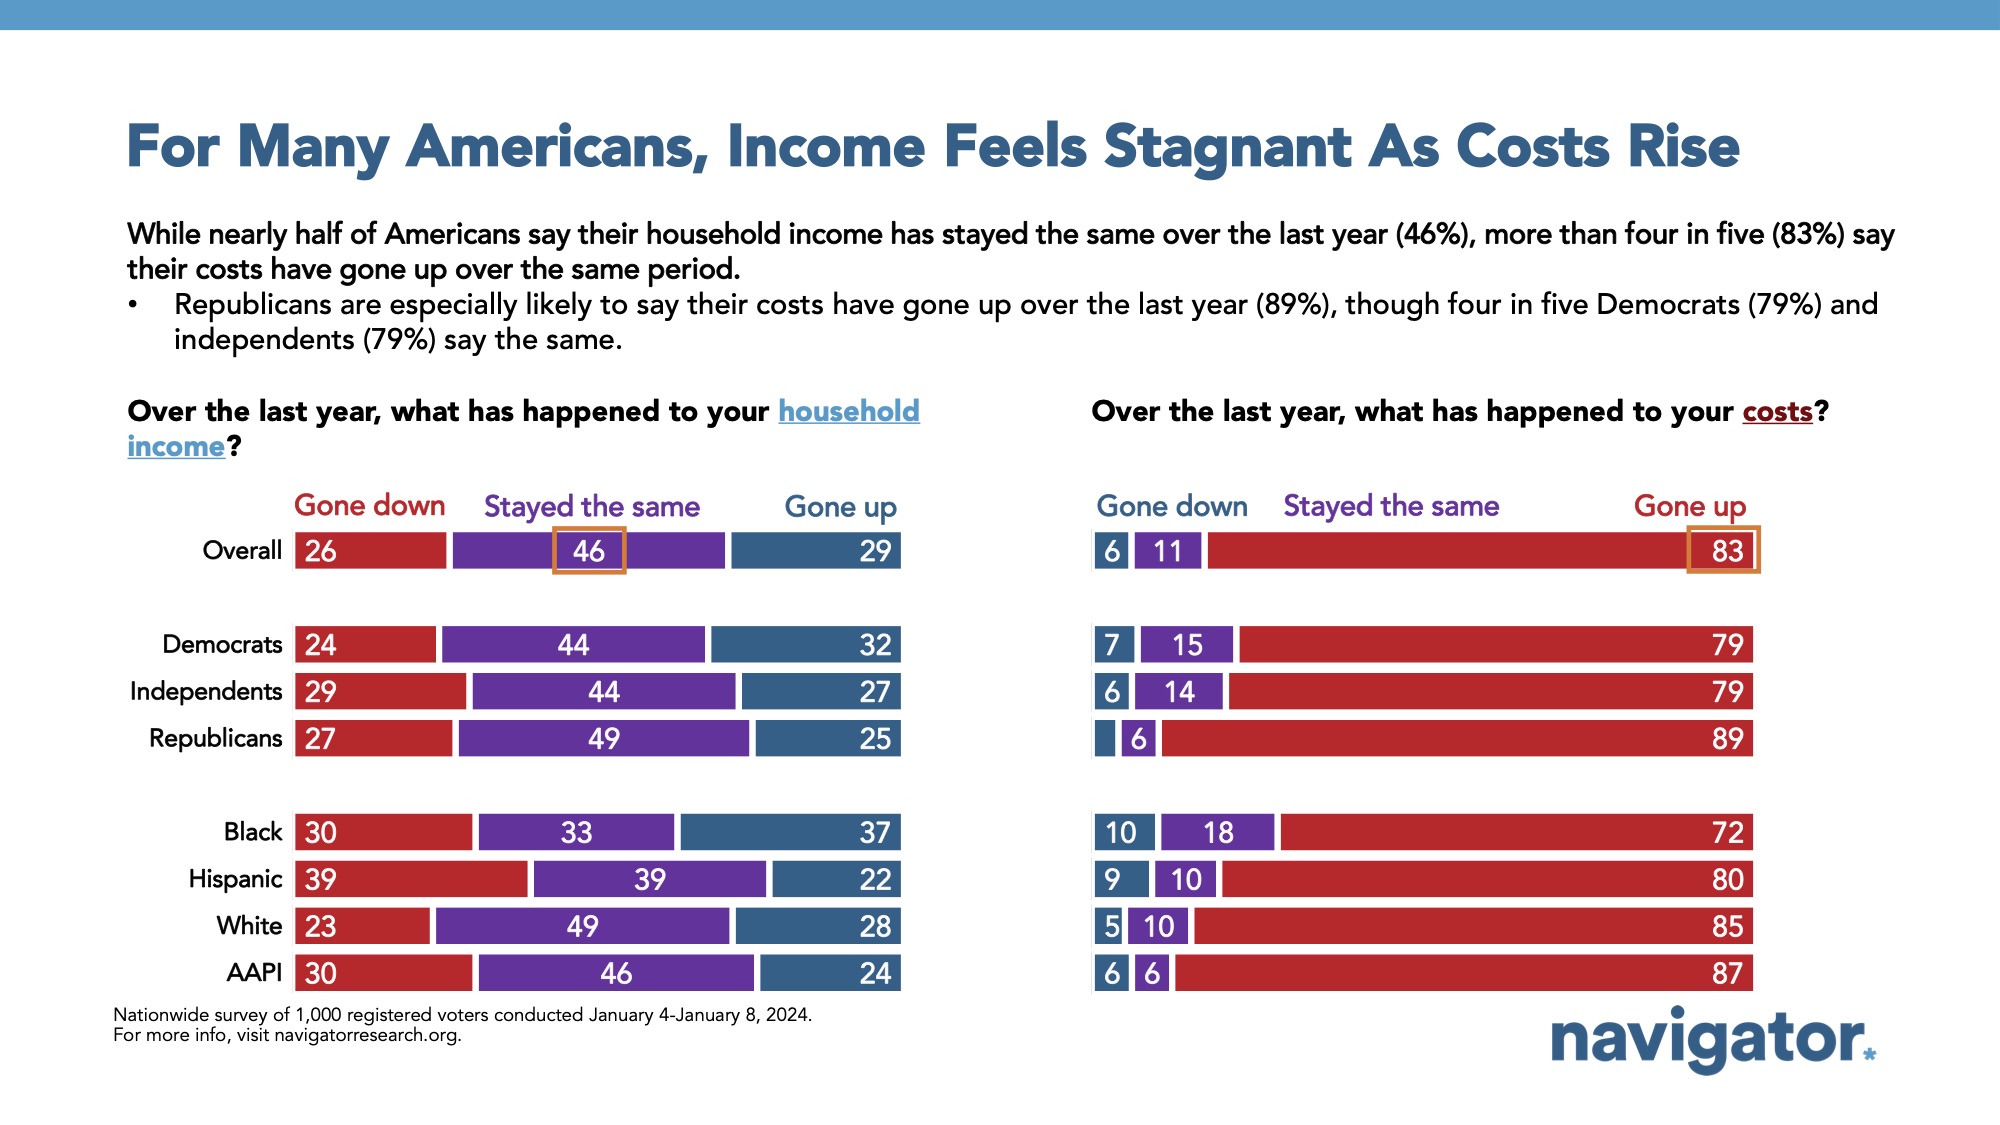
As inflation continues to be top of mind, four in five feel that costs have gone up while only three in ten say their household incomes have risen over the last year.
The vast majority of Americans feel that their costs have risen in the past year (83 percent) as nearly half feel their costs have risen significantly (49 percent). More than half of women feel their costs this past year have gone up a lot (55 percent), especially among women under the age of 55 (59 percent). At the same time, a plurality of Americans report that their household income has stayed the same in the past year, and only three in ten Americans feel their household income has gone up (29 percent), with lower shares among Americans living in households earning less than $50,000 per year (24 percent gone up) and those who work in the service industry (23 percent gone up).
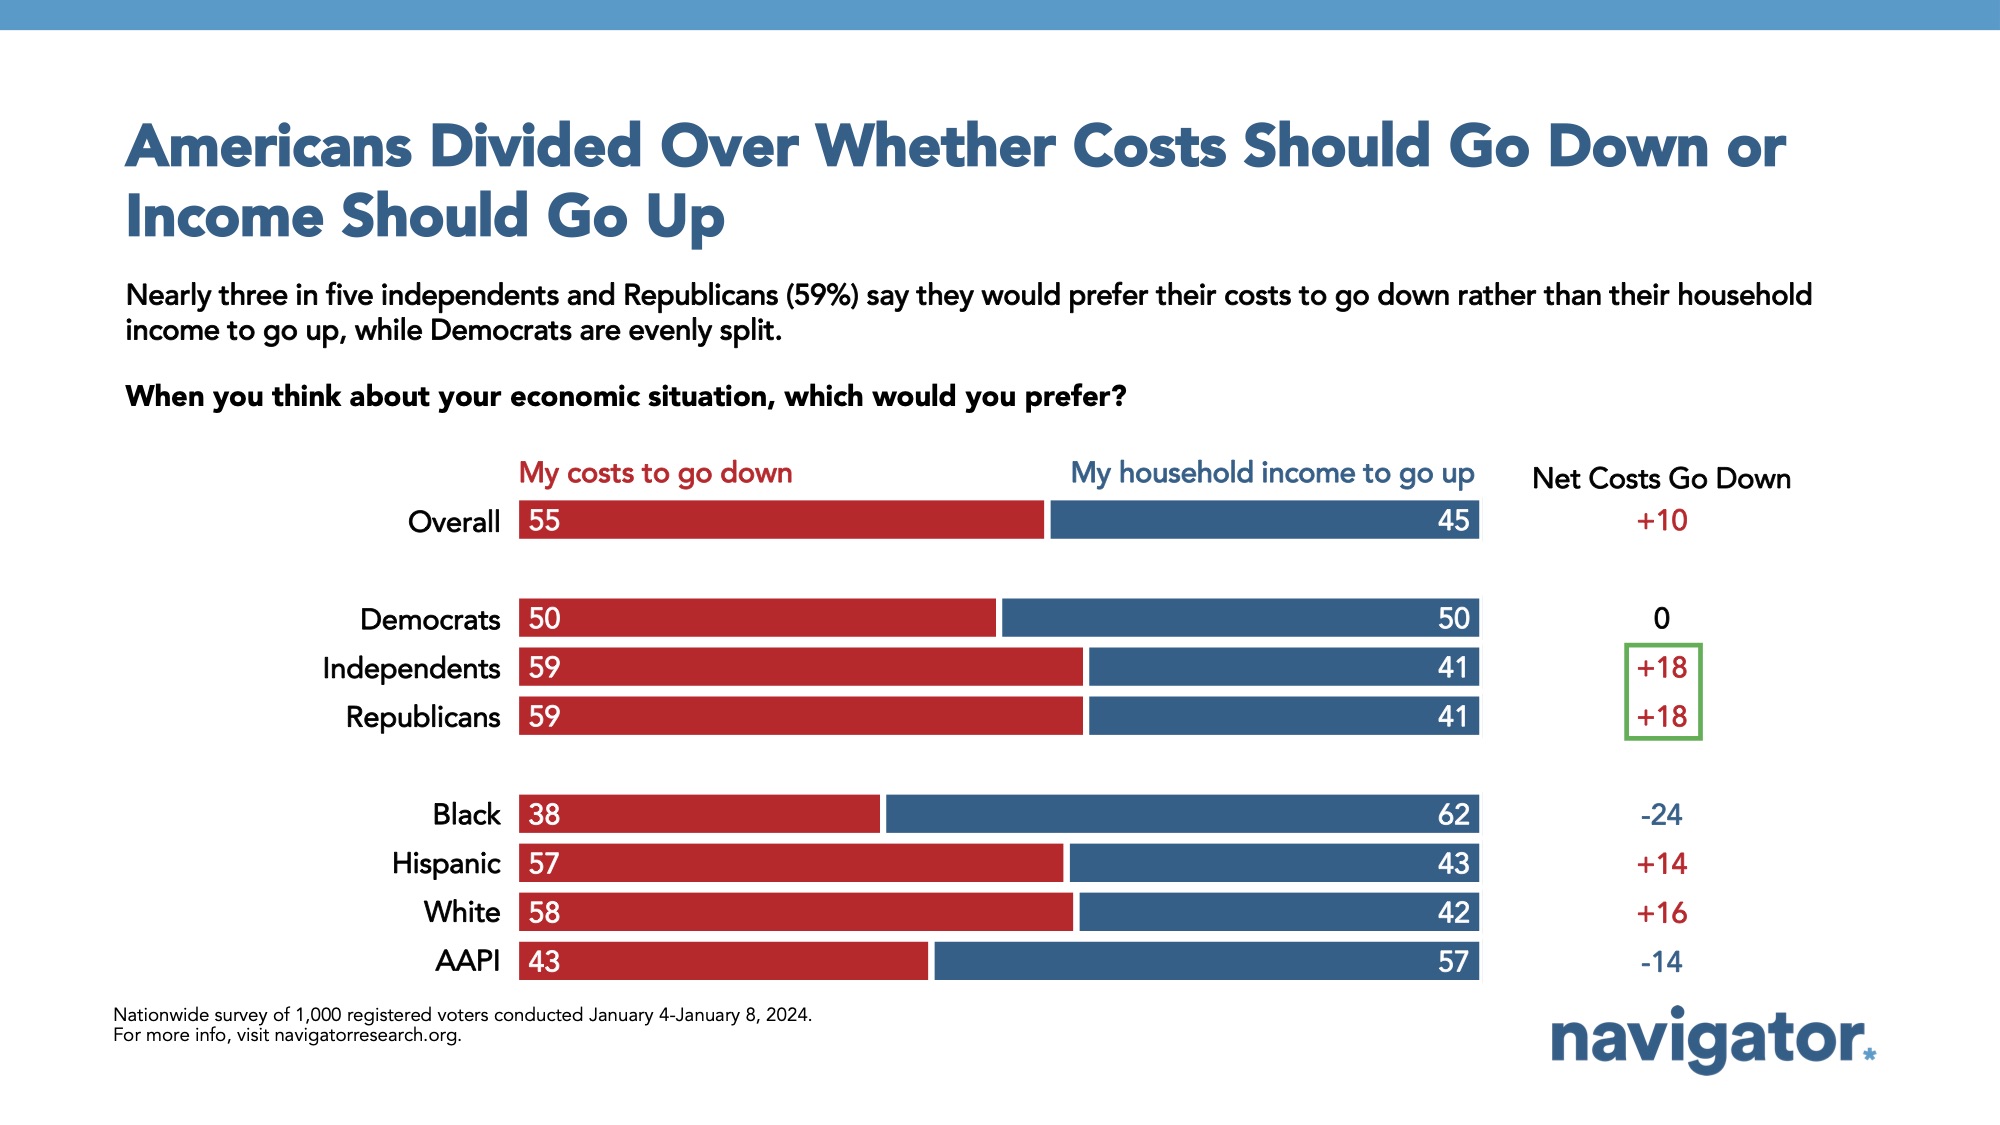
- In a forced choice question, more Americans would prefer costs to go down than for their household incomes to increase by a 10-point margin (55 percent costs go down – 45 percent household income to go up).
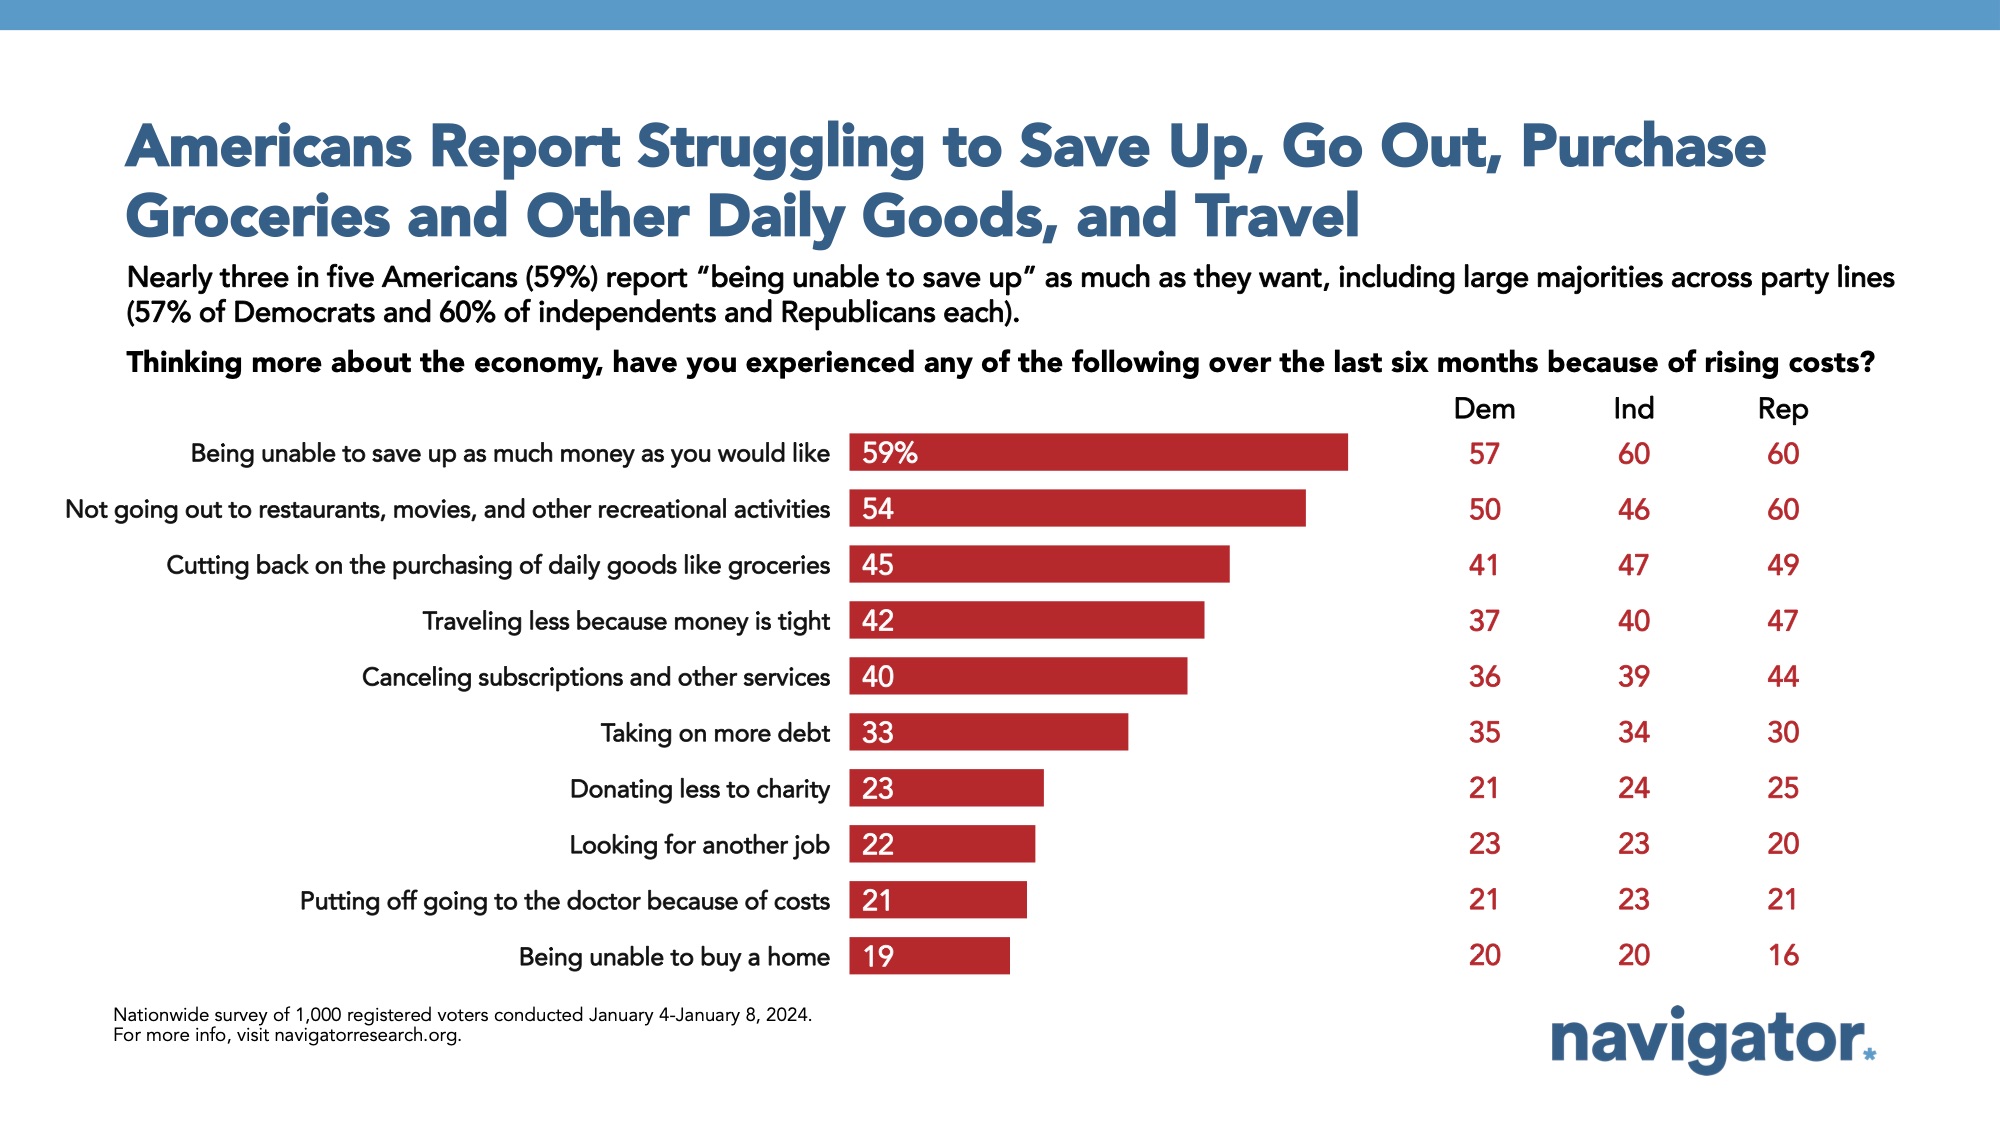
Americans report struggling to save up, go out, purchase groceries and other daily goods, and travel.
A significant share of Americans report being unable to adequately save, have cut back on recreational activities, purchased fewer daily goods like groceries, and traveled less over the last six months because of rising costs. Three in five report being unable to save up as much money as they would like (59 percent), including two in three Americans under 35 (66 percent) and women (64 percent). 54 percent of Americans report they have not been going out to restaurants, movies, and other recreational activities, 45 percent say they have been cutting back on the purchasing of daily goods like groceries, and 42 percent say they have been traveling less because money is tight.
- Additionally, two in five Americans under 35 report being unable to buy a home (39 percent compared to 19 percent of all Americans) and are looking for a new job (44 percent, compared to 22 percent of all Americans).
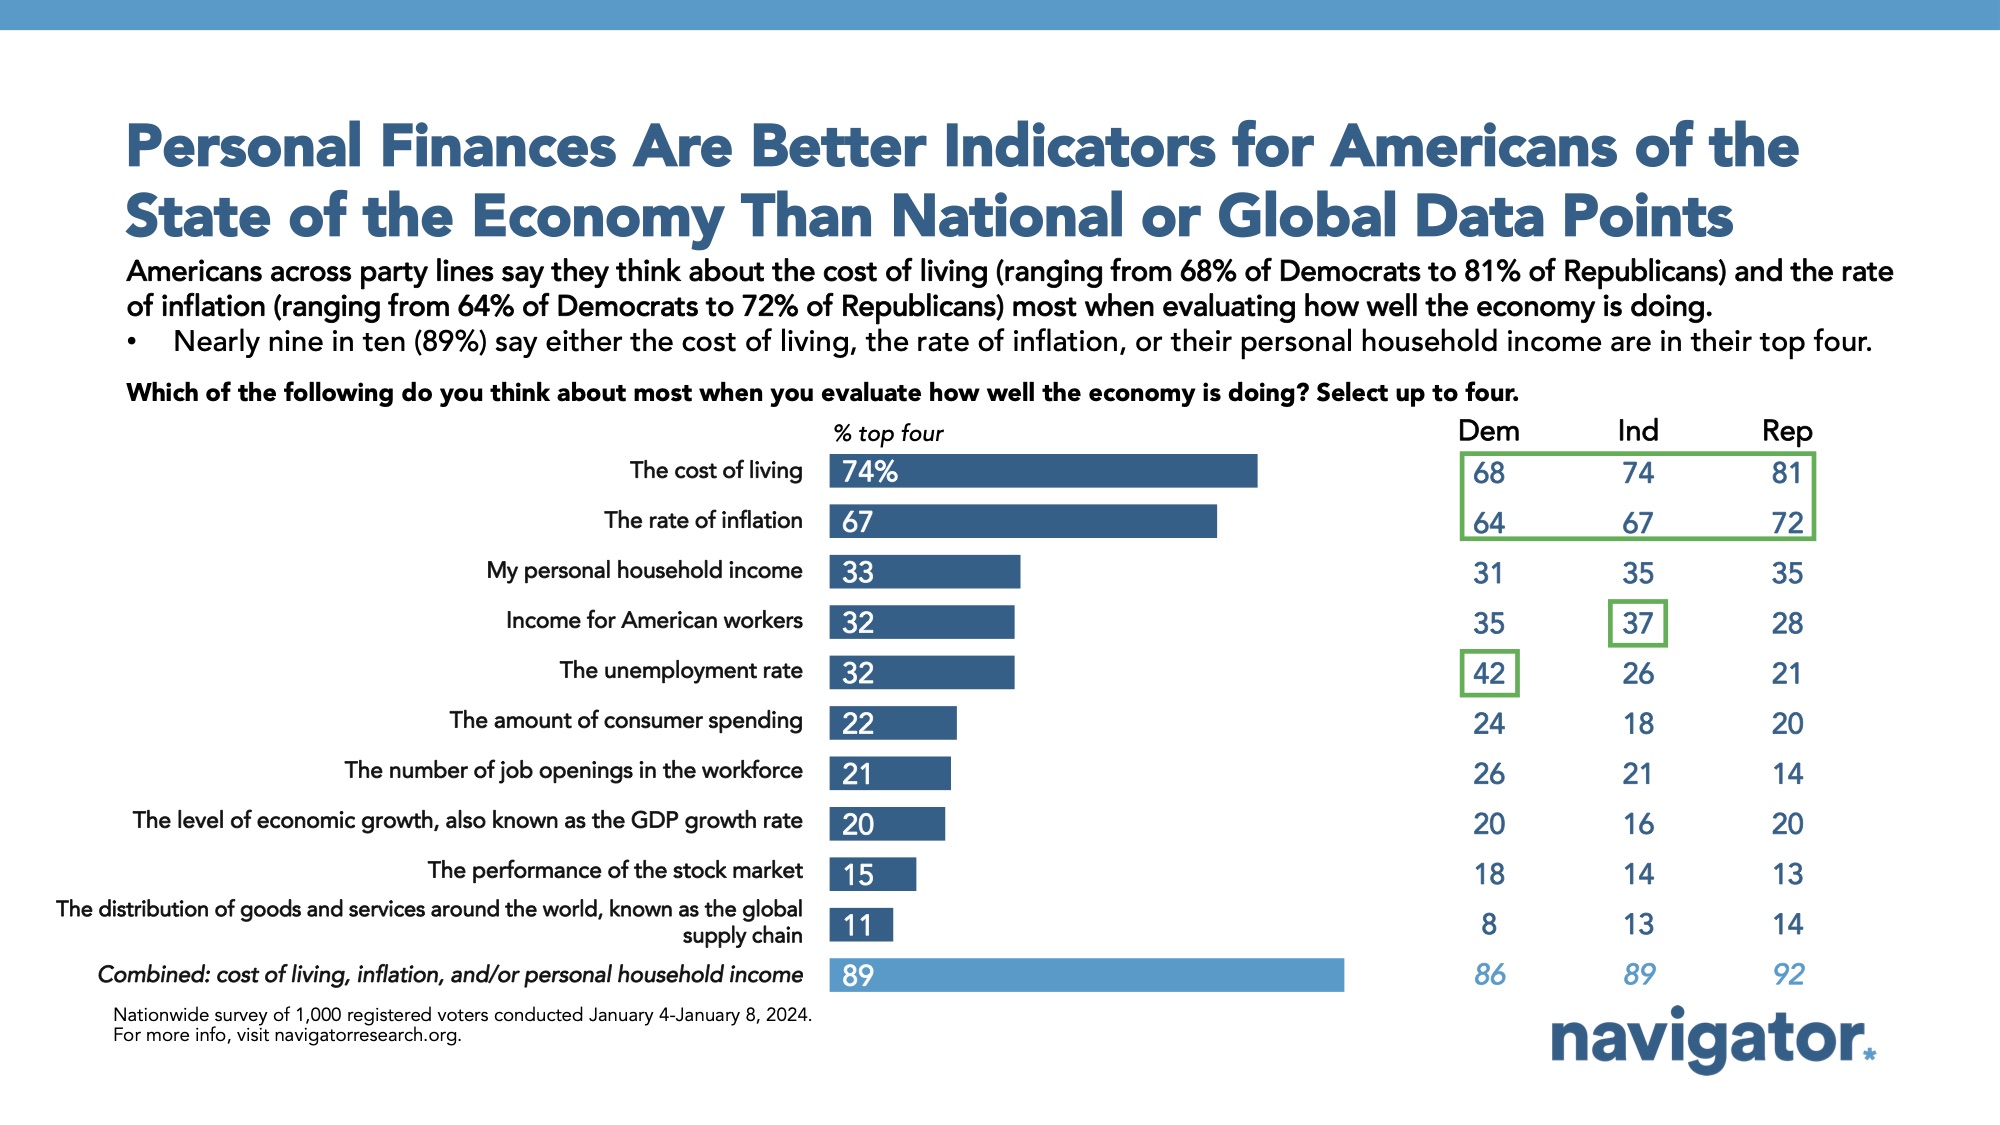
The cost of living, rate of inflation, and personal household incomes are the most commonly-used indicators to assess the state of the economy.
Three in four Americans utilize the cost of living when evaluating the economy’s strength (74 percent), followed by the rate of inflation (67 percent), and personal household income (33 percent). 89 percent of respondents selected at least one of these three as an indicator they use to assess the economy.
- The indicators cited least for assessing the state of the economy include GDP growth rate (20 percent), the performance of the stock market (15 percent), and the global supply chain (11 percent).
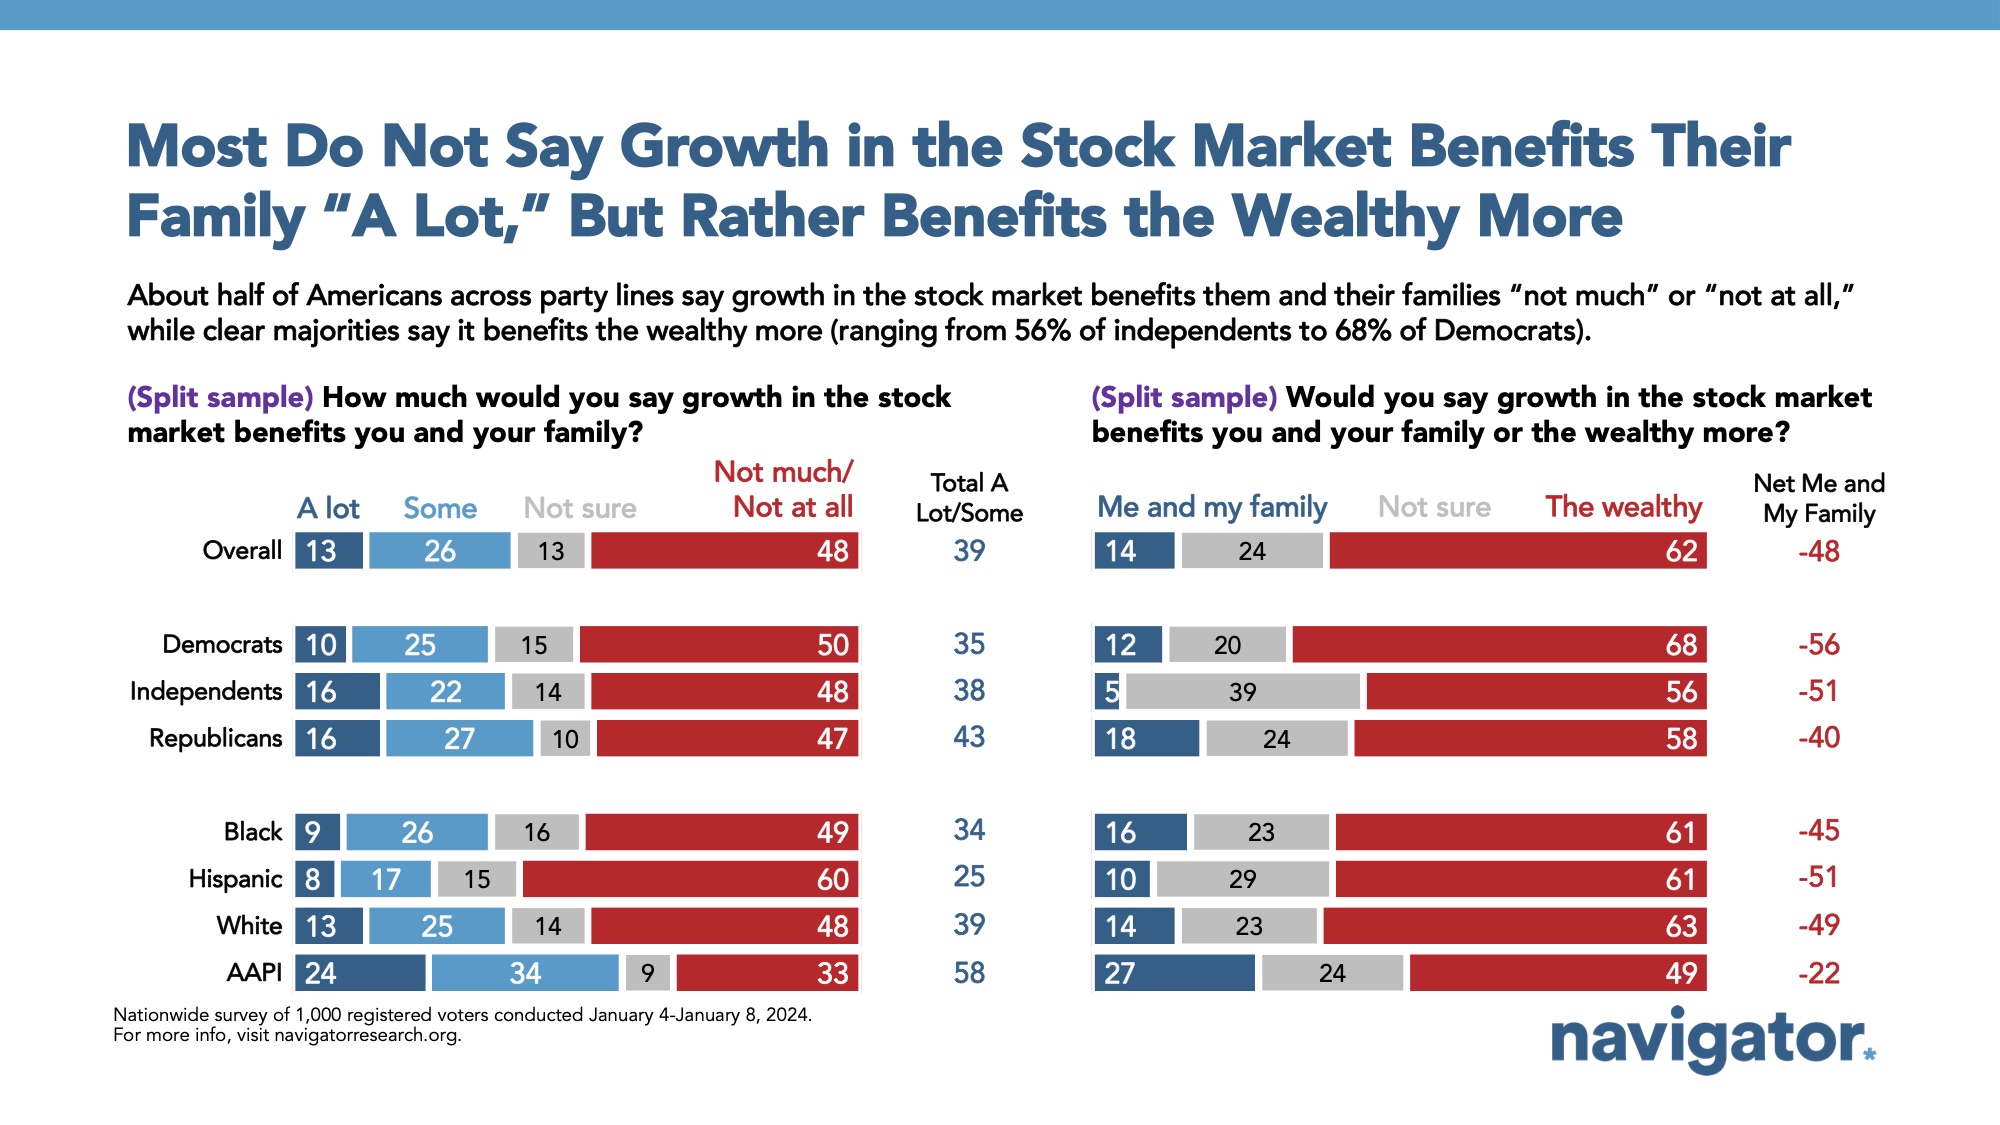
Two in three Americans feel that the growth in the stock market benefits the wealthy as opposed to themselves or their families.
By a 48-point margin, most feel growth in the stock market primarily benefits the wealthy (62 percent the wealthy – 14 percent me and my family), and is felt across party lines, including among two in three Democrats (68 percent benefit the wealthy more), three in five Republicans (58 percent benefits the wealthy more) and a majority of independents (56 percent benefits the wealthy more). Additionally, when asked whether stock market growth benefits them and their family, only 39 percent felt at least some benefit, and only 13 percent reported it benefited themselves and their families “a lot.”
- Nearly one third of Americans living in households earning more than $100,000 per year feel growth in the stock market benefits them and their families “a lot” (31 percent; 63 percent say it benefits them at least some) compared to only 5 percent of Americans earning less than $50,000 per year who say the same (27 percent say it benefits them at least some).
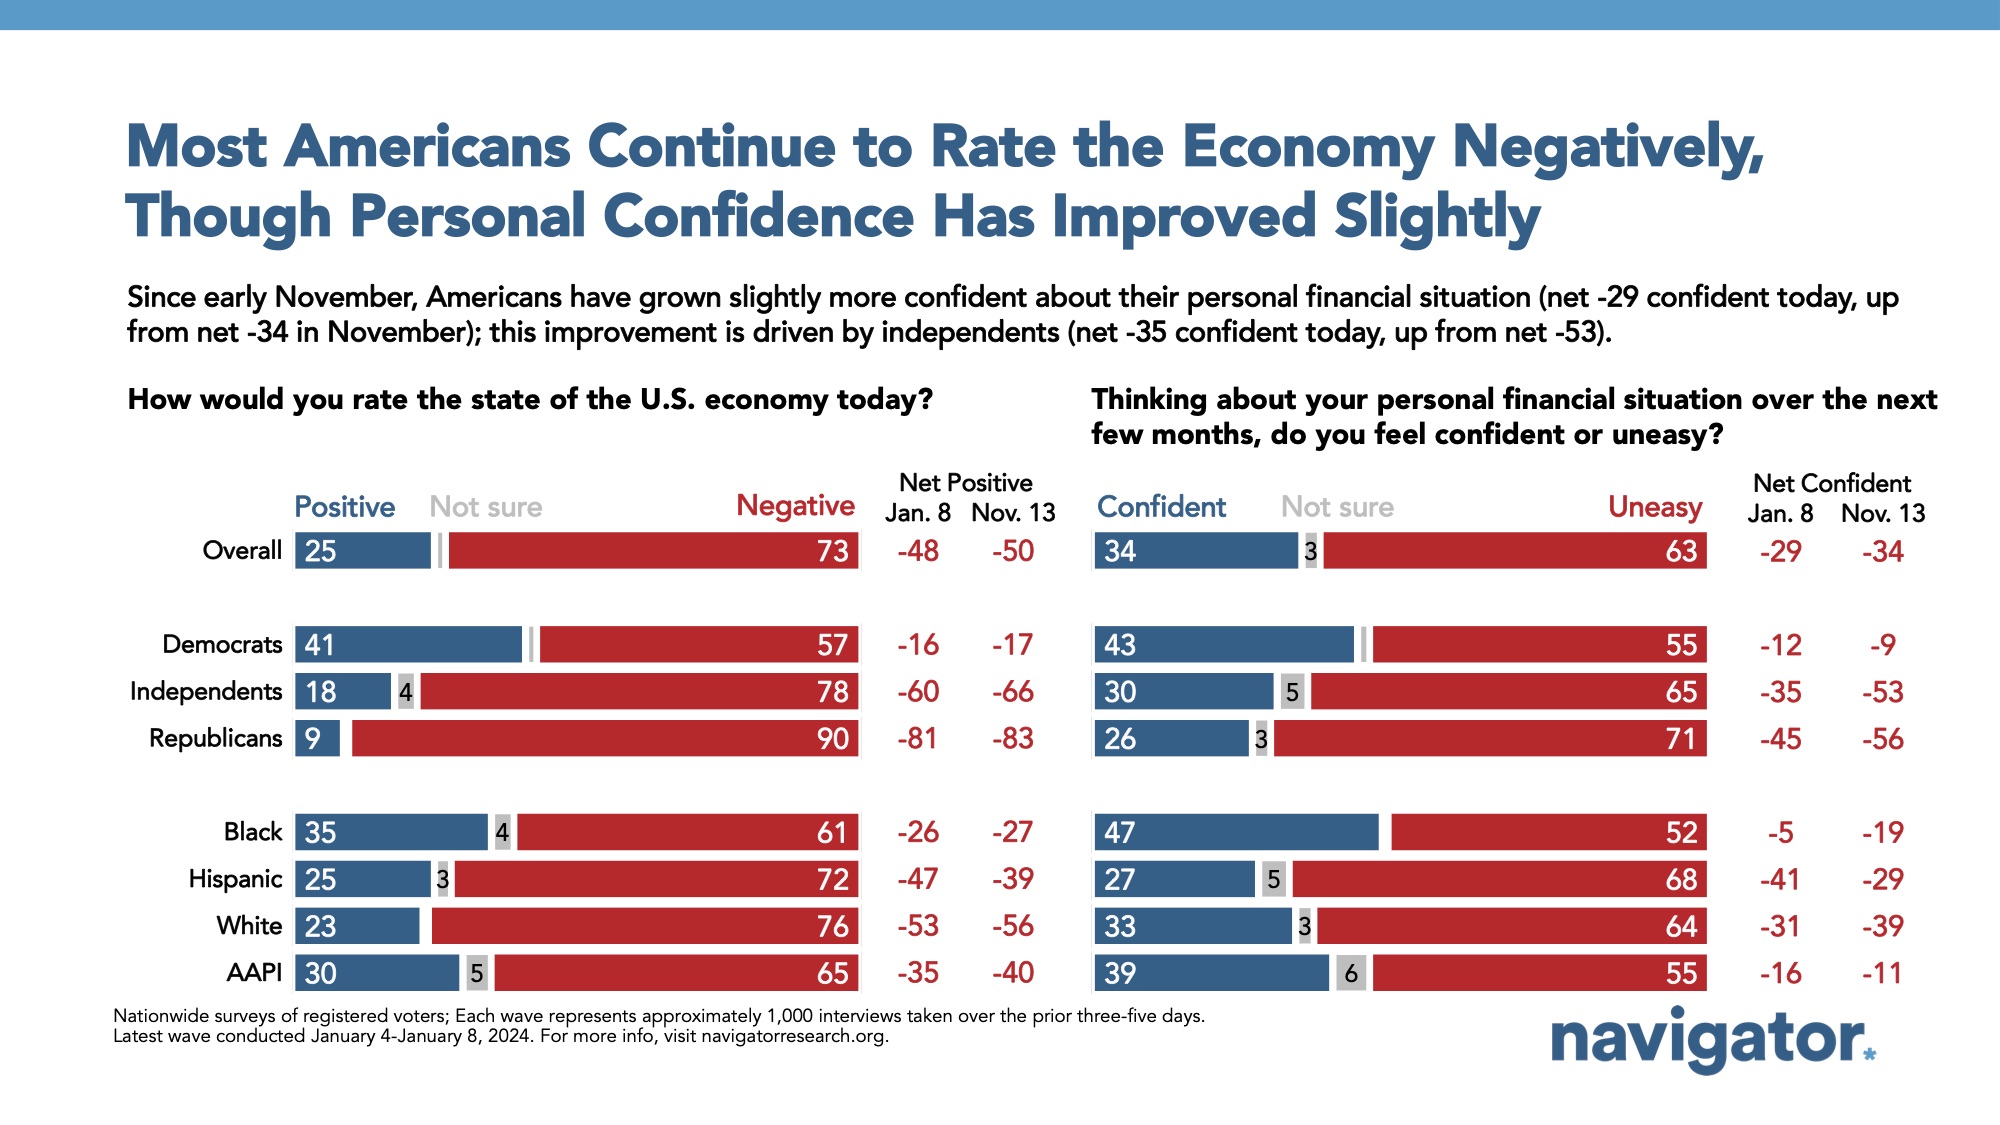
Three in four Americans negatively rate the economy as three in five feel uneasy about their personal finances.
73 percent of Americans rate the economy as either “not so good” or “poor,” with pessimism particularly high among Americans under the age of 35 (net -59; 19 percent positive – 78 percent negative). Additionally, only one in three Americans feel confident about their personal finances (34 percent), with higher levels of uneasiness among Americans under 35 (32 percent) and college-educated women (30 percent).
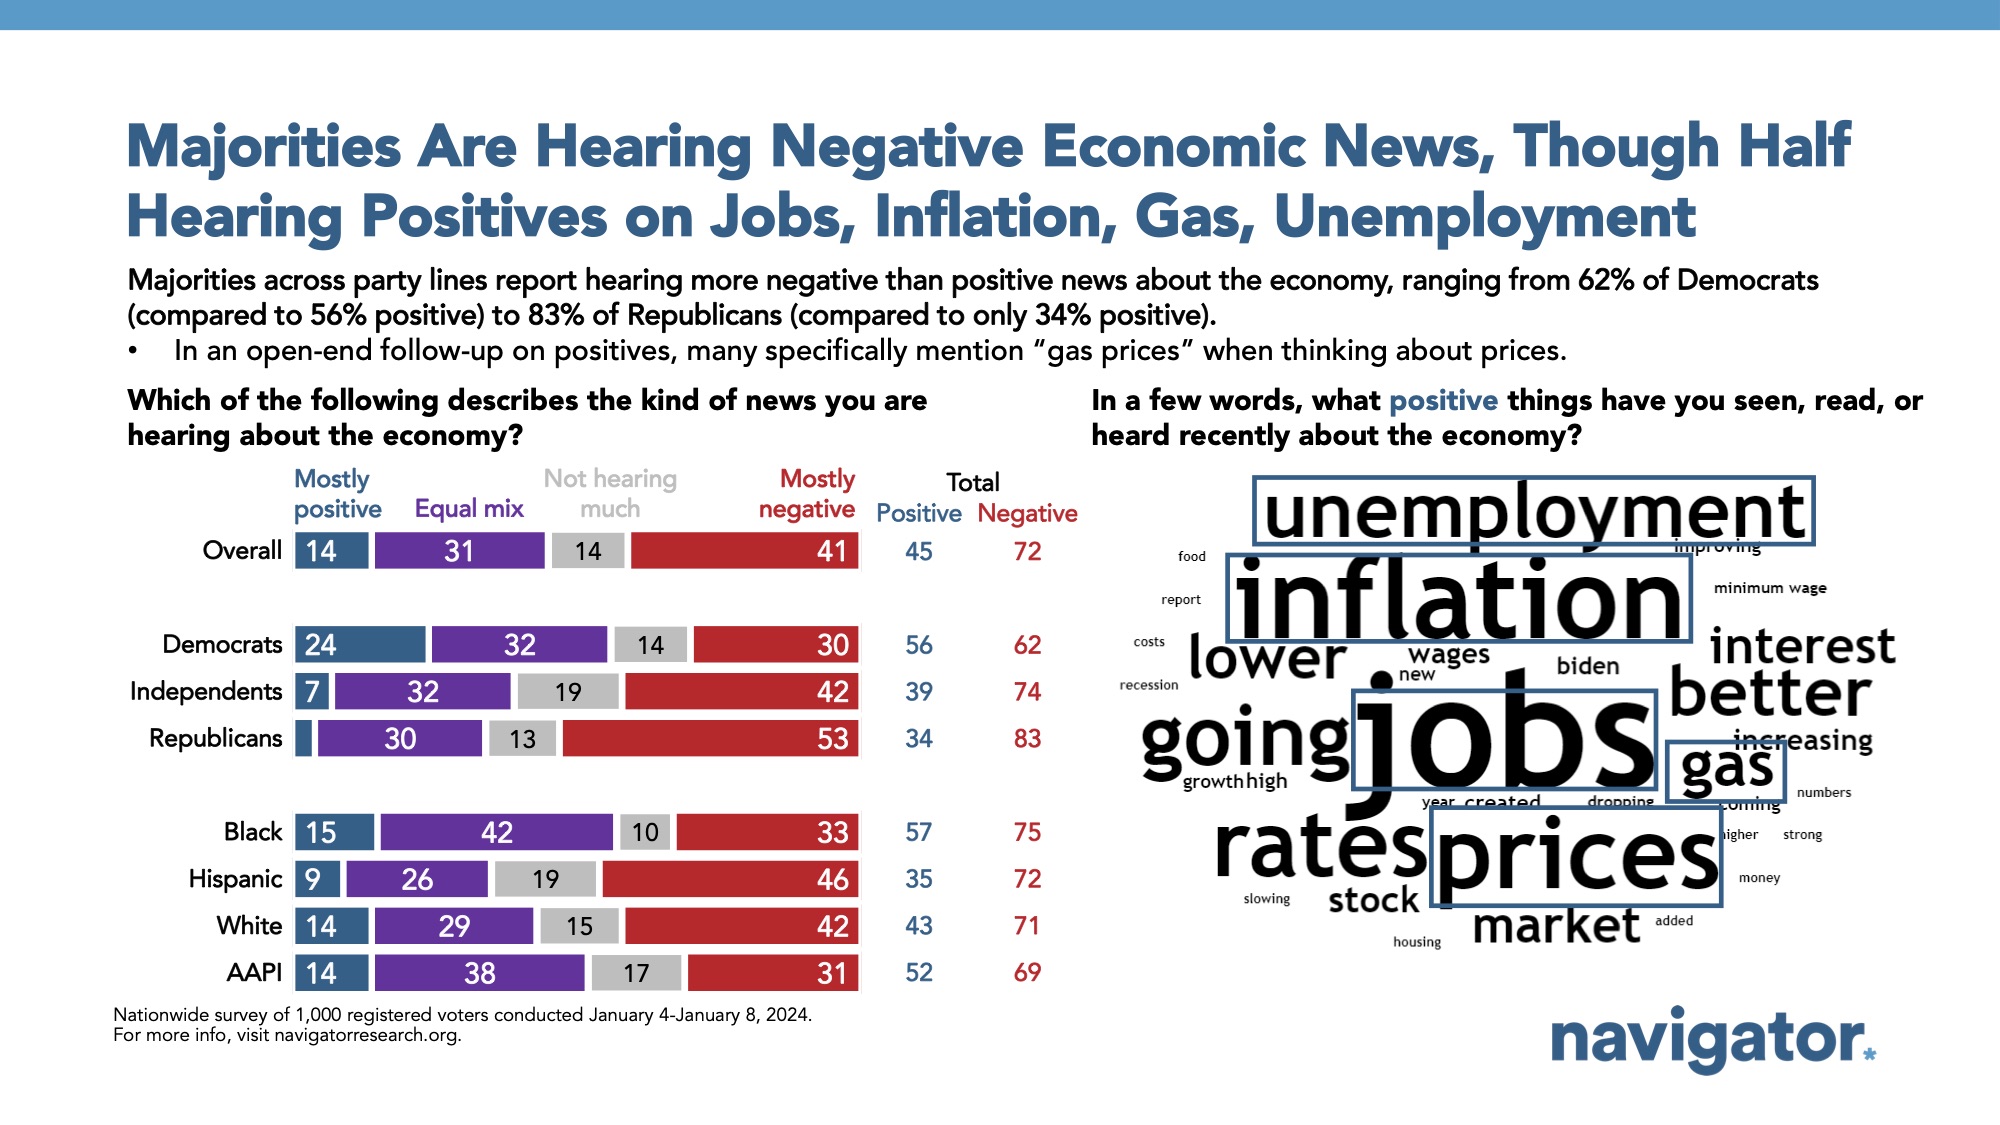
- While nearly three in five Americans report hearing mostly negative news about the economy (72 percent), nearly half of Americans also report hearing at least some positive news about the economy (45 percent), with the positives mostly focused on a low unemployment rate, declining inflation, job creation, and prices coming down, particularly gas prices.
