Poll: Trump, January 6th, and Speaker Mike Johnson
This Navigating the Battleground report contains polling data on Americans’ latest perceptions of political violence like January 6th, as well as how battleground constituents view House Speaker Mike Johnson and House Republican lawmakers’ governing agenda.
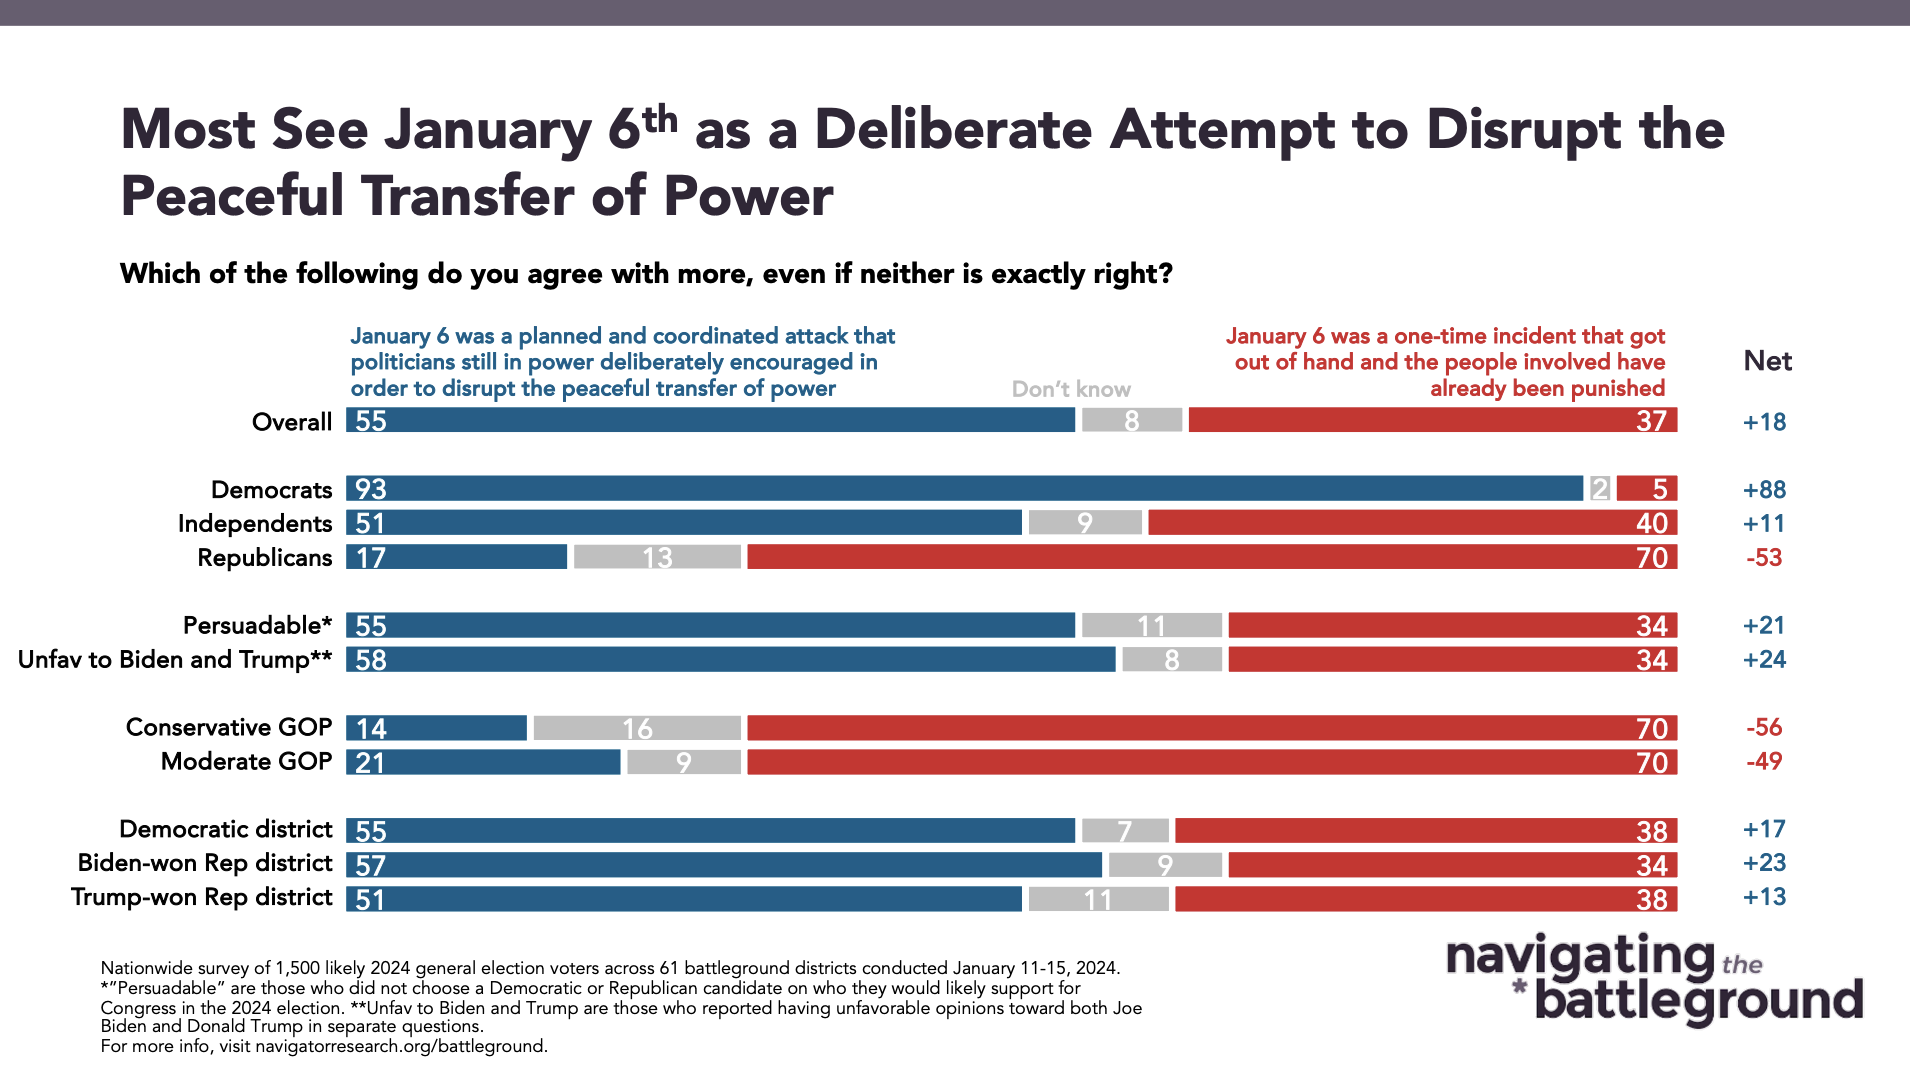
A majority believe January 6th was a planned attack to deliberately disrupt a peaceful transfer of power.
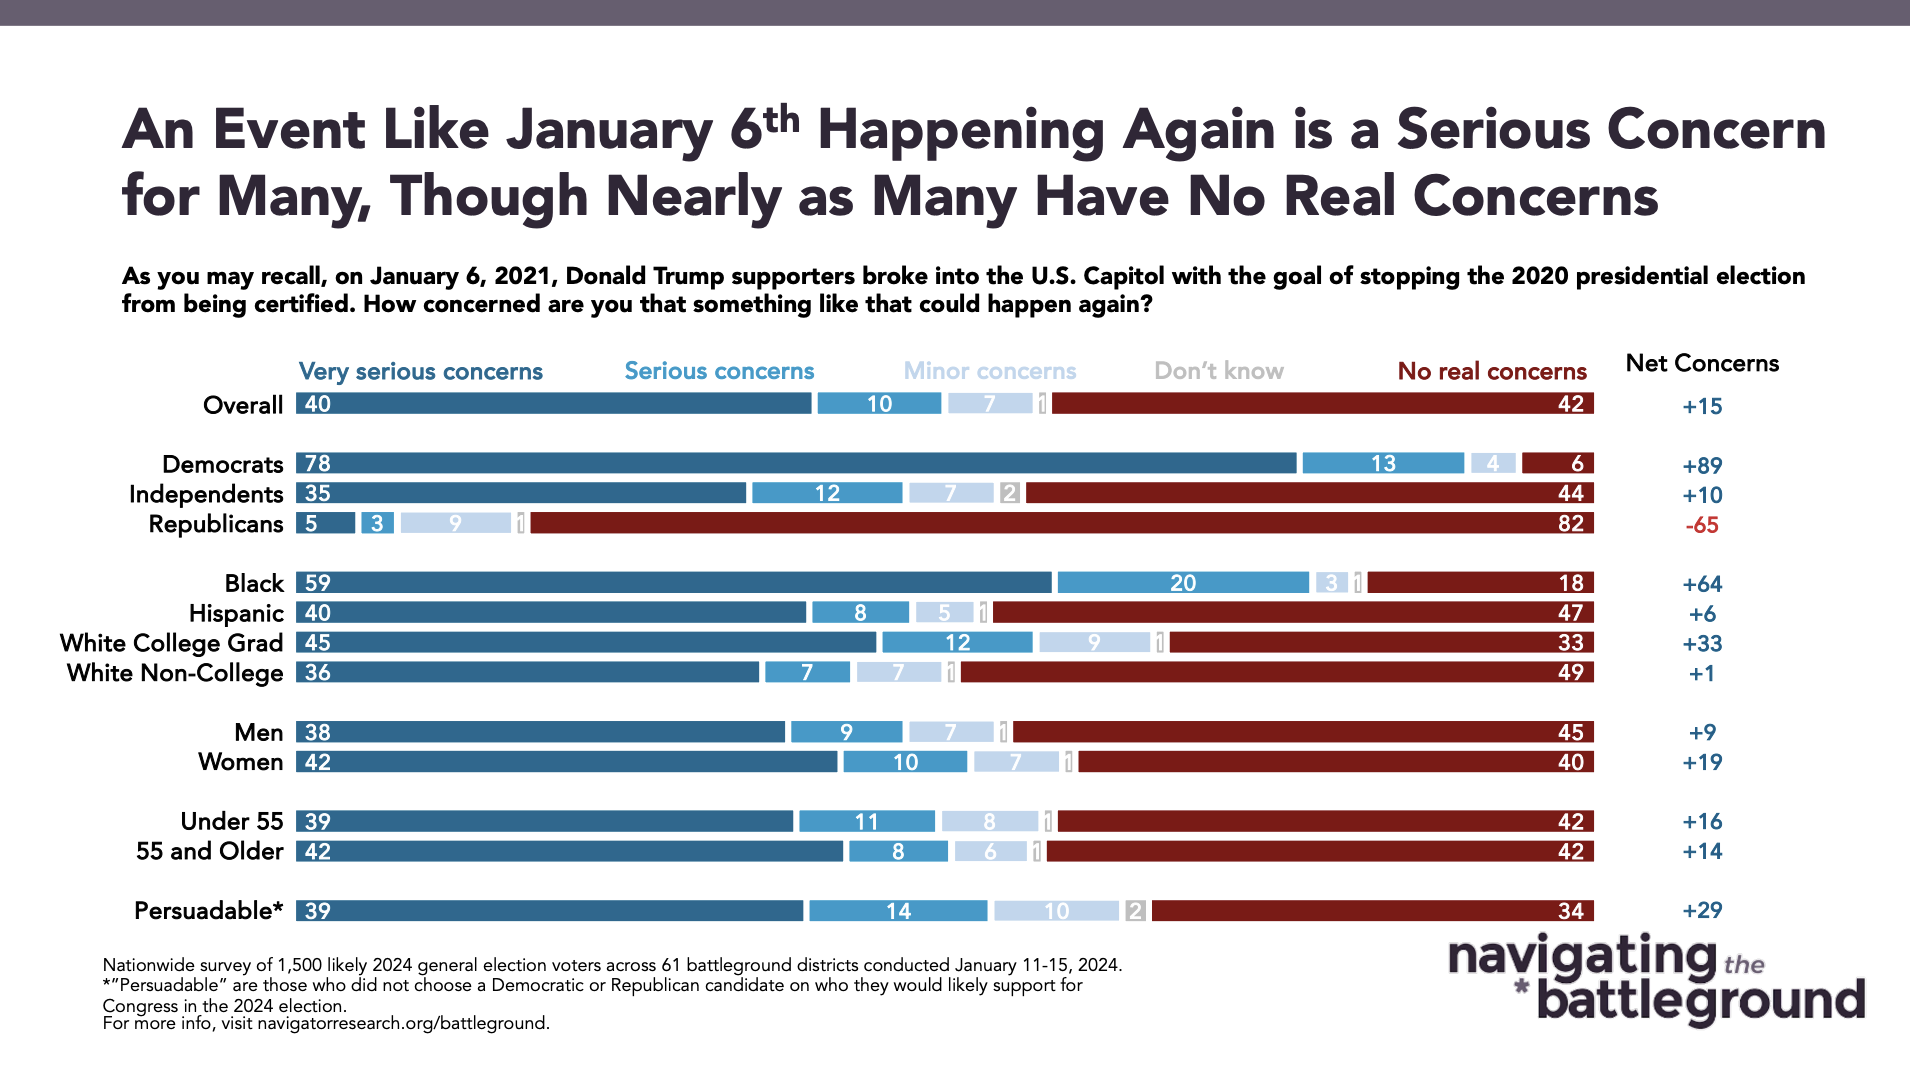
By an 18-point margin, most battleground constituents agree more that “January 6 was a planned and coordinated attack that politicians still in power deliberately encouraged in order to disrupt the peaceful transfer of power” (55 percent) than agree that “January 6 was a one-time incident that got out of hand and the people involved have already been punished” (37 percent), including over half of independents (net +11; 51 percent planned attack – 40 percent one-time incident). Additionally, by a 15-point margin, nearly two in three Americans in battleground districts have at least some concerns that an event similar to the attack on the Capitol on January 6th could happen again (57 percent have concerns – 42 percent have no real concerns), including 40 percent who have “very serious” concerns. By 52 points, three in four constituents who are unfavorable to both President Biden and former President Trump believe that an event similar to January 6th could occur again (75 percent have concerns – 23 percent no real concerns).
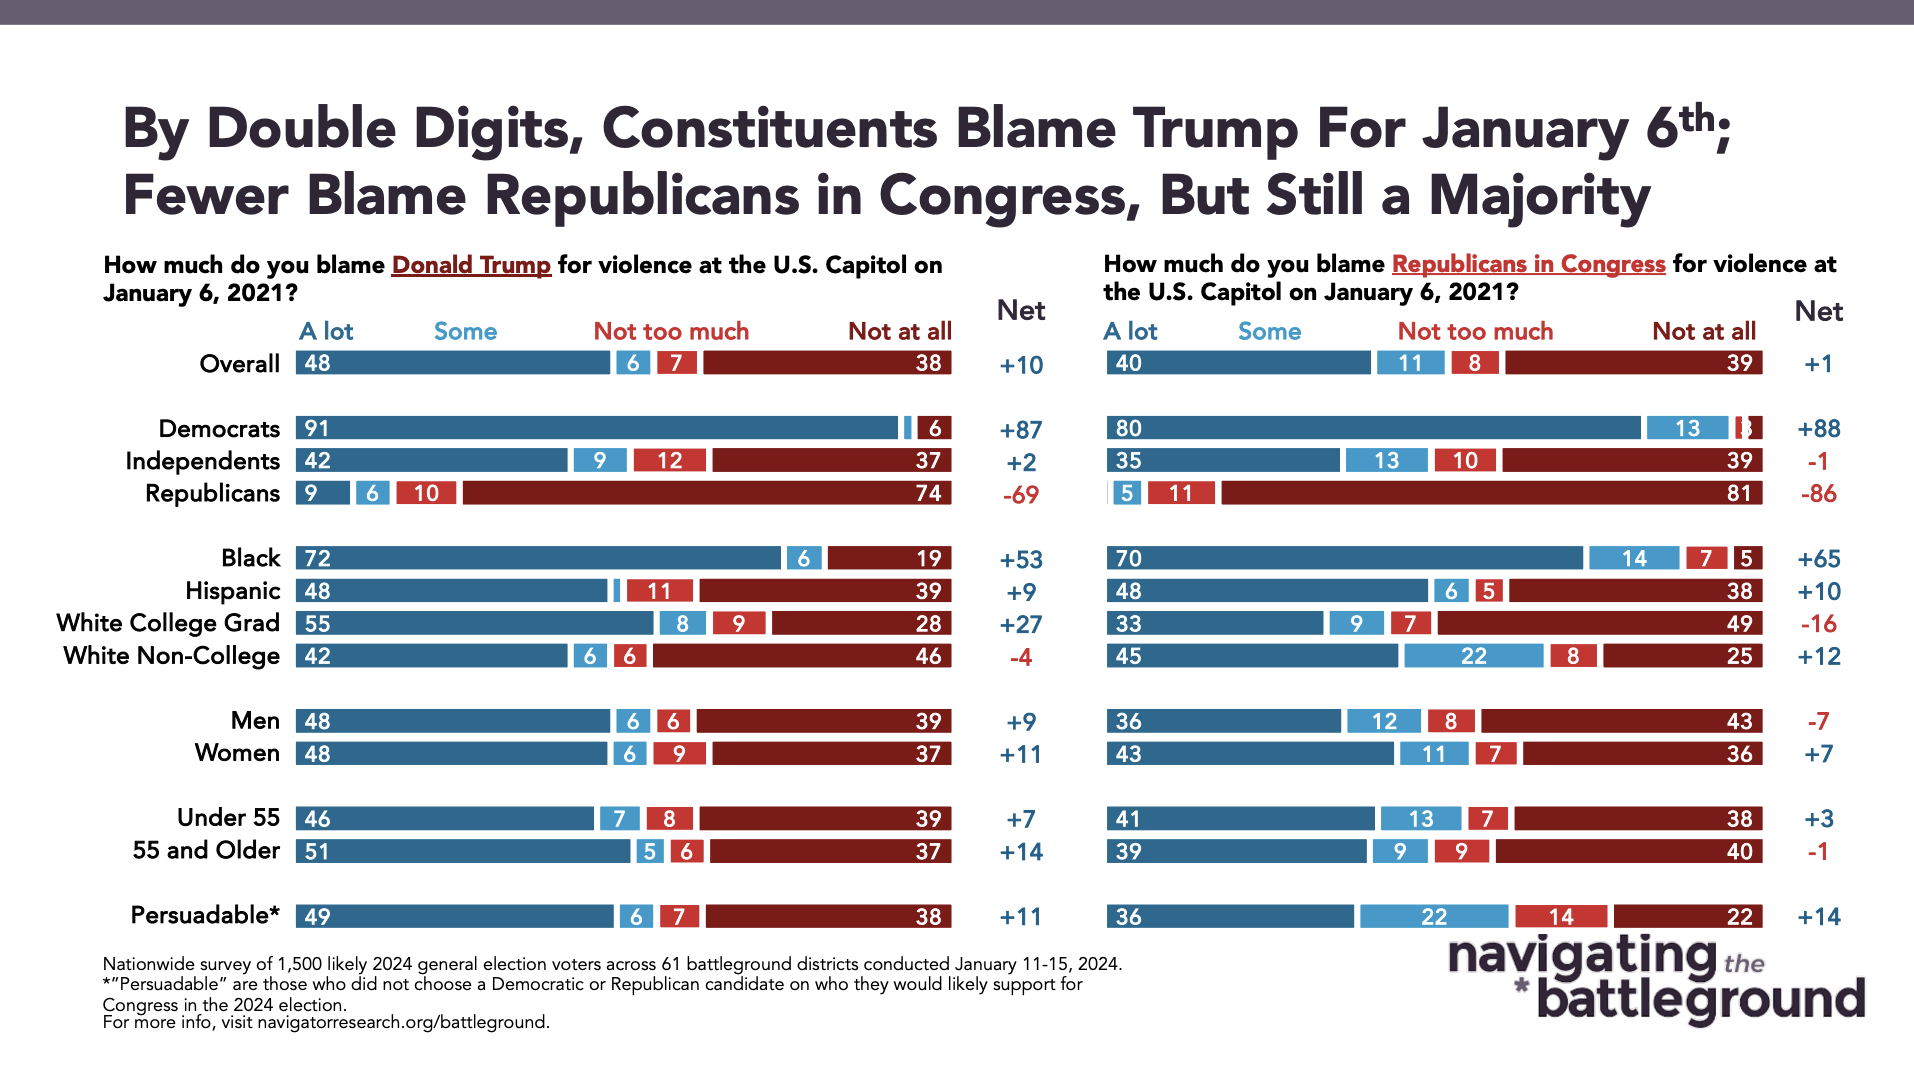
Majorities blame both Trump and Republicans in Congress for the violence at the Capitol on January 6th.
54 percent of constituents in battleground districts believe Donald Trump is to blame for the events of January 6th, including 48 percent who blame Trump “a lot” for the violence. Similarly, 51 percent believe Republicans in Congress are to blame for the violence at the Capitol on January 6th, including 40 percent who blame Republicans in Congress “a lot” for the violence. A plurality of battleground constituents are more likely to believe the Republican Party will use political violence to further their agenda than the Democratic Party by 6 points (41 percent Democratic Party more likely – 47 percent Republican Party more likely). Constituents who are unfavorable toward both Trump and Biden believe the Republican Party is more likely than the Democratic Party to use political violence by 25 points (21 percent Democratic Party more likely – 46 percent Republican Party more likely).
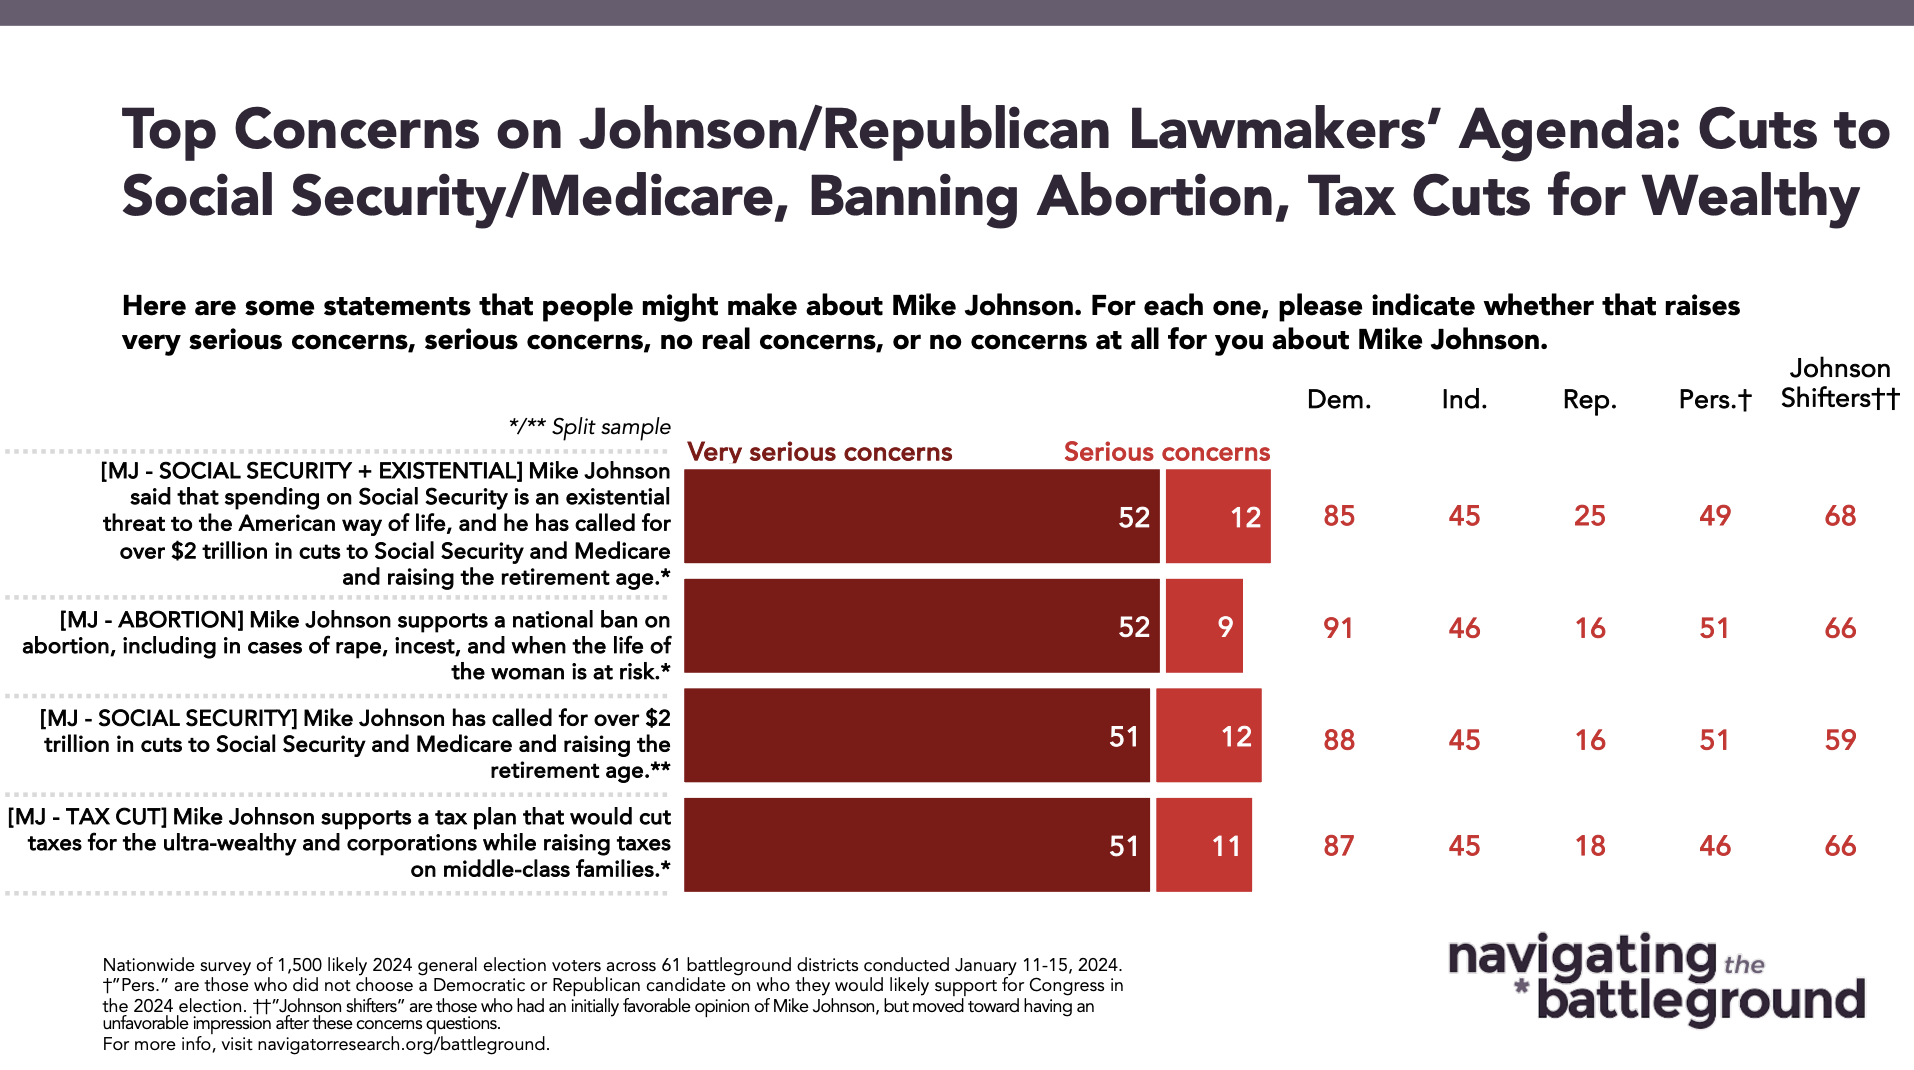
Battleground constituents are most concerned about Speaker Mike Johnson and Republican lawmakers’ policy agenda of cuts to Social Security and Medicare, banning abortion, and tax cuts for the ultra-wealthy.
Most battleground constituents have very serious concerns about Speaker Johnson “support[ing] a national ban on abortion, including in cases of rape, incest, and when the life of the woman is at risk” (52 percent very serious concerns, with an additional 9 percent saying they have serious concerns), as well as Speaker Johnson “saying that spending on Social Security is an existential threat to the American way of life, calling for over $2 trillion in cuts to Social Security and Medicare and raising the retirement age” (52 percent very serious concerns, with an additional 12 percent saying they have serious concerns).
- A majority of battleground constituents also have very serious concerns about Speaker Johnson’s support for “a tax plan that would cut taxes for the ultra-wealthy and corporations while raising taxes on middle-class families” (51 percent very serious concerns, with an additional 11 percent saying they have serious concerns). This includes 70 percent of constituents who are unfavorable to both Biden and Trump that have either serious or very serious concerns about the support for Republican lawmakers’ tax plan.
About The Study
Impact Research conducted public opinion surveys among a sample of 1,500 likely 2024 general election voters from January 11-15, 2024. The survey was conducted by text-to-web (100 percent). Respondents were verified against a voter file and special care was taken to ensure the demographic composition of our sample matched that of the 61 congressional districts included in the sample across a variety of demographic variables. The margin of error for the full sample at the 95 percent level of confidence is +/- 2.5 percentage points. The margin for error for subgroups varies and is higher.
