Poll: Improving the Economy
This Navigator Research report contains polling data on Americans’ latest perceptions of the economy, including what economic areas Americans are most likely to say are improving, and what Americans find are the most convincing proof points of an improving economy.
Views of the economy have improved modestly, though most Americans still feel uneasy.
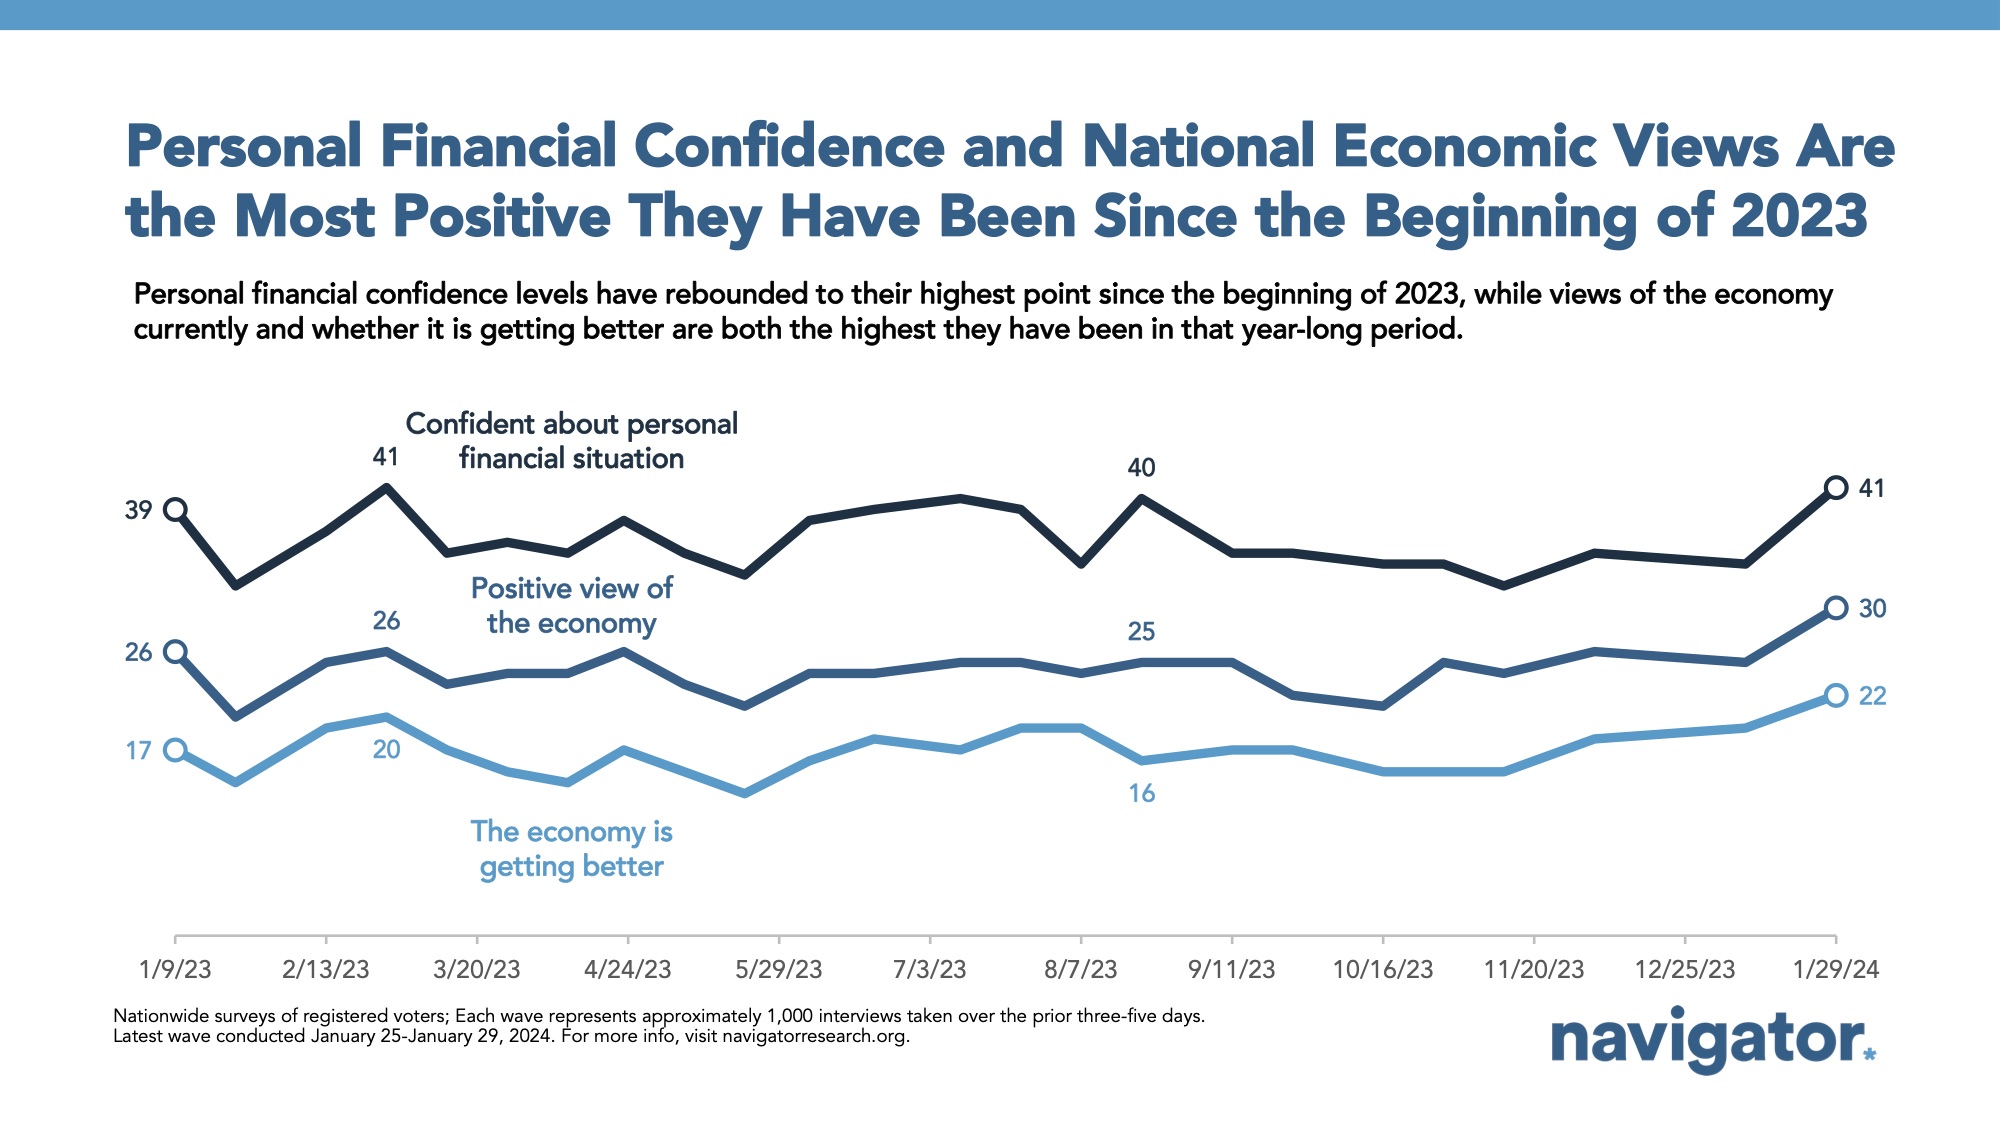
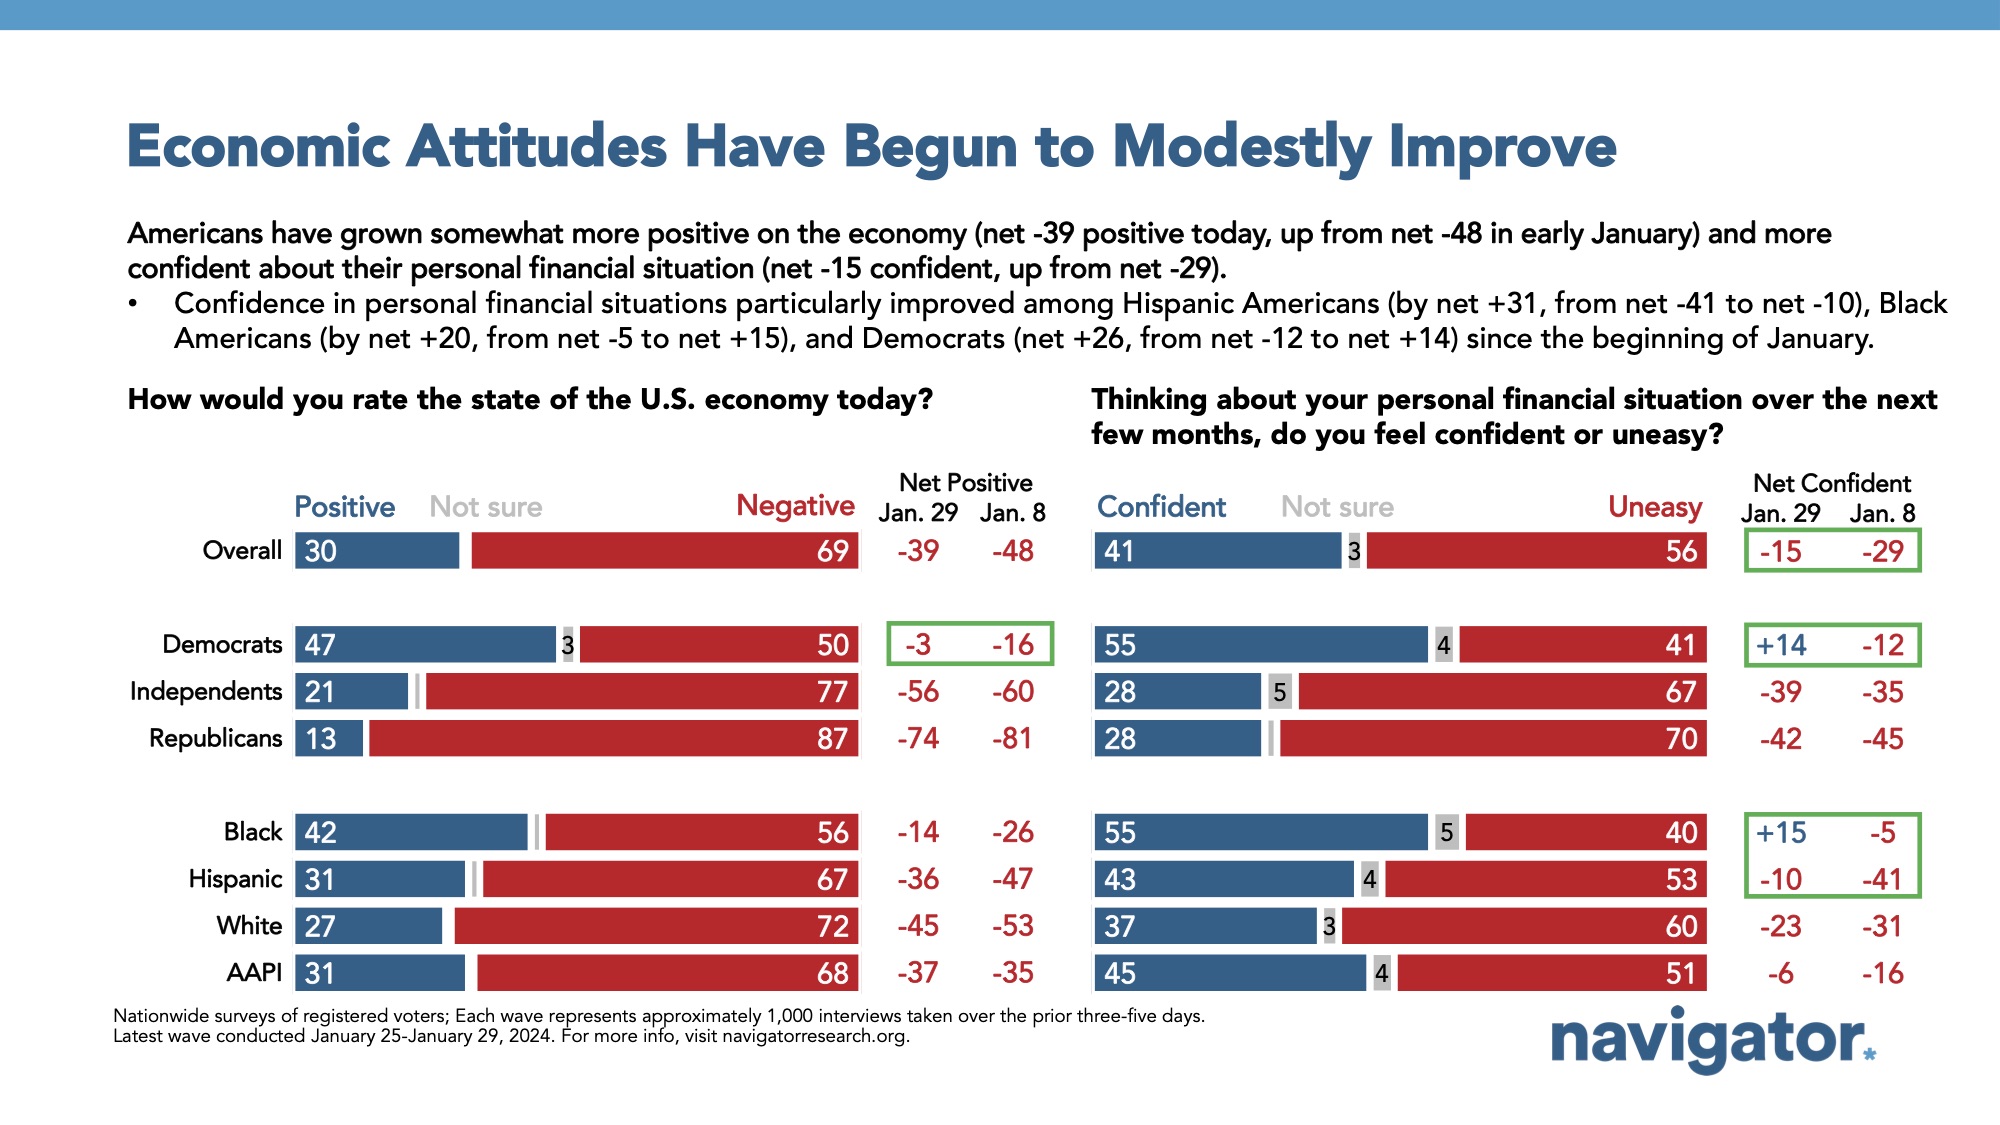
There has been a net 11 point increase in perceptions of the state of the U.S. economy since mid-November (from net -50 to net -39); however, seven in ten Americans rate the economy negatively compared to just three in ten percent who rate it positively (30 percent positive – 69 percent negative). This mirrors a similar uptick in perceptions of the economy observed in our research in closely-divided House districts: while overall perceptions remained net negative in mid-January, there was a net 12-point improvement compared to three months earlier (from net -47 in October to net -35 in January).
- Confidence in personal financial situations has also improved slightly: though a majority still say they feel uneasy (net -15; 41 percent confident – 56 percent uneasy), this has also improved by a net 19 points since November (net -34; 32 percent confident – 66 percent uneasy).
- Economic sentiment has improved most among Democrats, with half rating the economy negatively (net -3; 47 percent positive – 50 percent negative) compared to last month when nearly three in five rated the economy negatively (net -16; 41 percent positive – 57 percent negative). Other demographics where there have been sizable upticks in positive ratings toward the economy include college-educated men (from net -39 to net -7), those living in households earning less than $50,000 per year (from net -56 to net -41), and Americans who do not have children in their household (from net -48 to net -34).
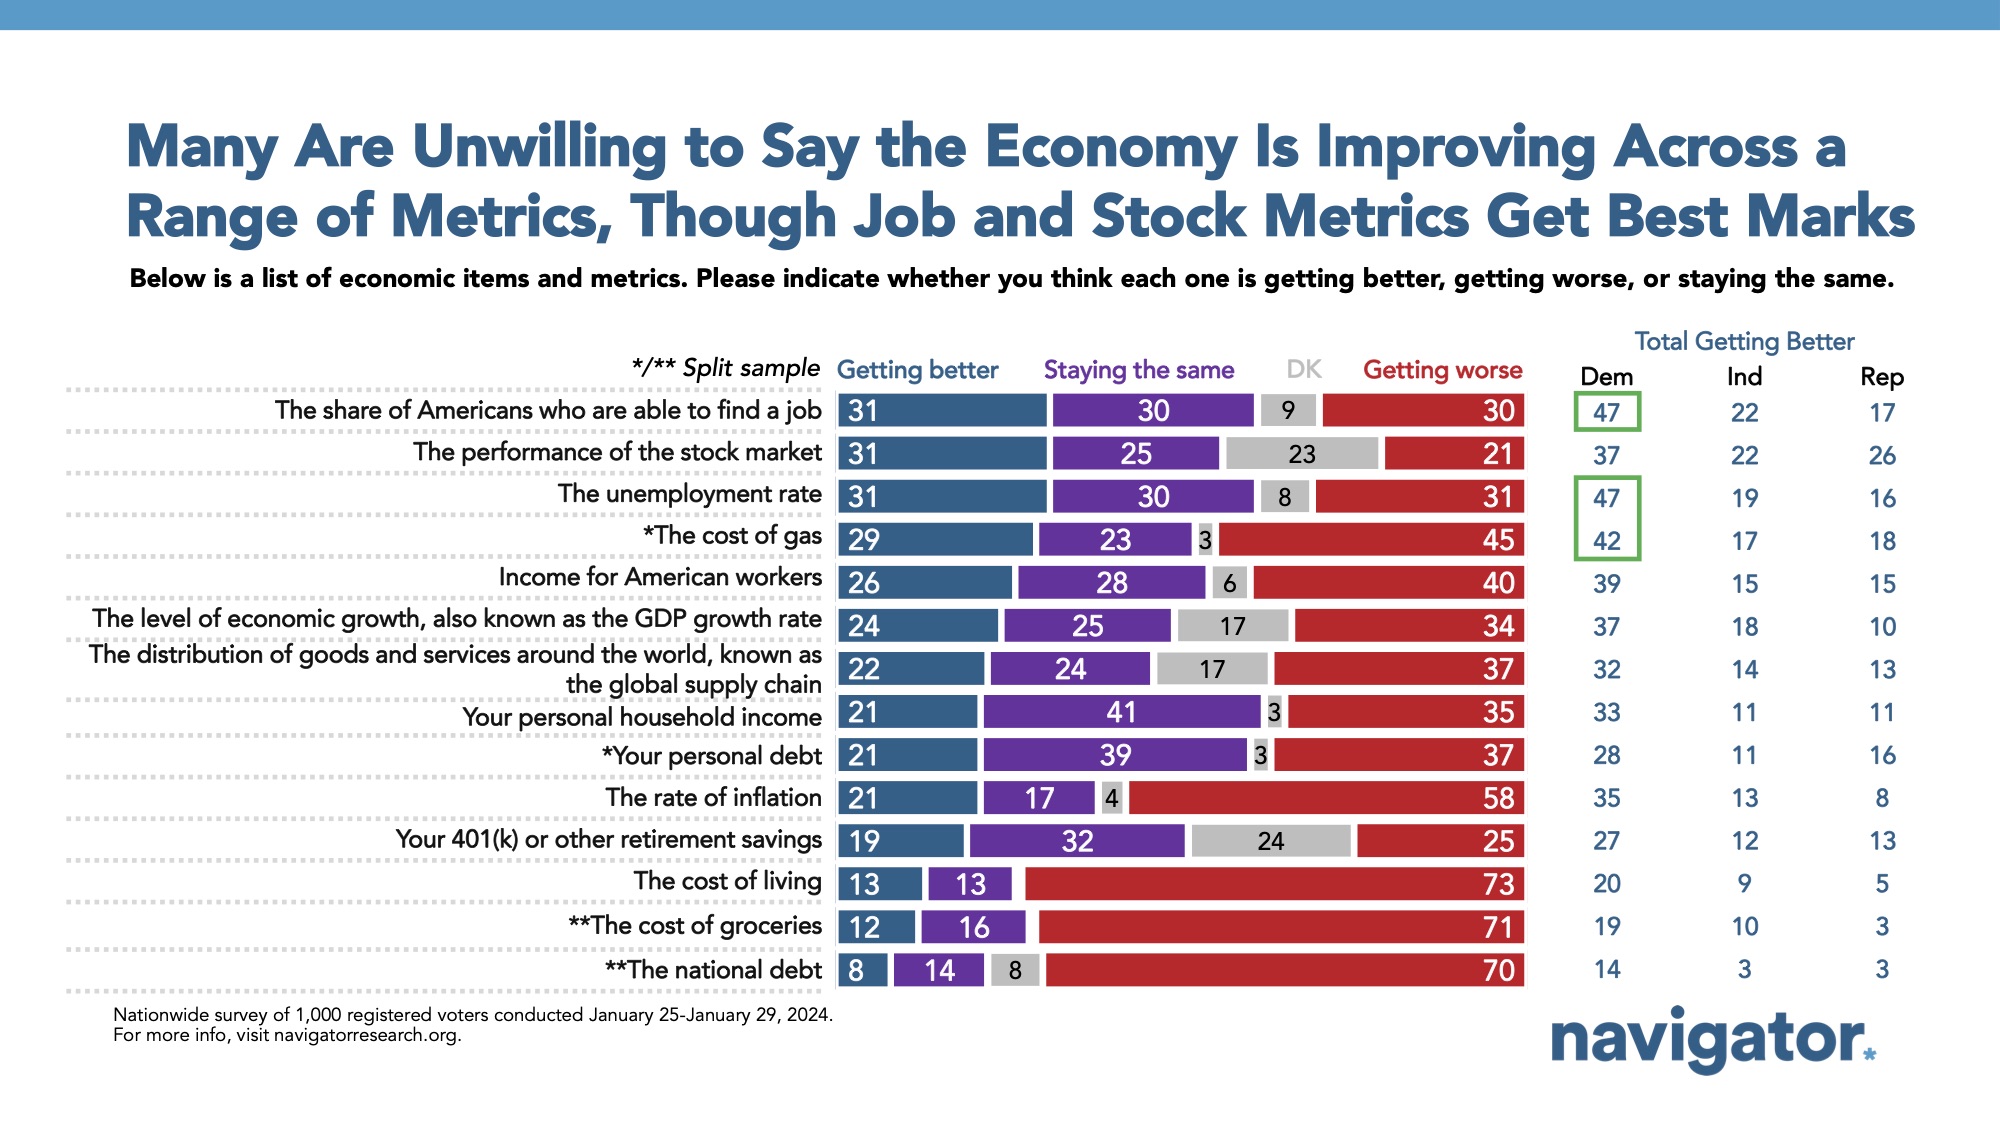
Americans are largely split on whether a variety of macroeconomic indicators related to employment are getting better or worse.
Americans are split on whether macroeconomic indicators like the number of jobs being created, the stock market, and the unemployment rate are improving, but are much more negative in rating personal indicators. While Americans are roughly split on the state of these metrics, they are most likely to say the following are getting better: the share of Americans who can find jobs (net +1; 31 percent better – 30 percent worse, with an additional 39 percent saying this is staying the same or who are unsure), the stock market (net +10; 31 percent better – 21 percent worse, with an additional 48 percent saying this is staying the same or who are unsure), and the unemployment rate (net even; 31 percent better – 31 percent worse, with an additional 38 percent saying this is staying the same or who are unsure).
- Personal economic indicators are the most likely to be seen as getting worse, including the cost of living (net -60; 13 percent better – 73 percent worse, with an additional 14 percent saying this is staying the same or who are unsure) and the cost of groceries (net -59; 12 percent better – 71 percent worse, with an additional 17 percent saying this is staying the same or who are unsure).
- Reminder: In our research last month, we found that people say they judge the strength of the economy through a microeconomic lens rather than a macroeconomic one. 89 percent of all respondents said they used the cost of living, the inflation rate, and/or personal household income as an indicator to assess the overall economy’s strength. The indicators cited least for assessing the state of the economy include GDP growth rate (20 percent), the performance of the stock market (15 percent), and the global supply chain (11 percent).
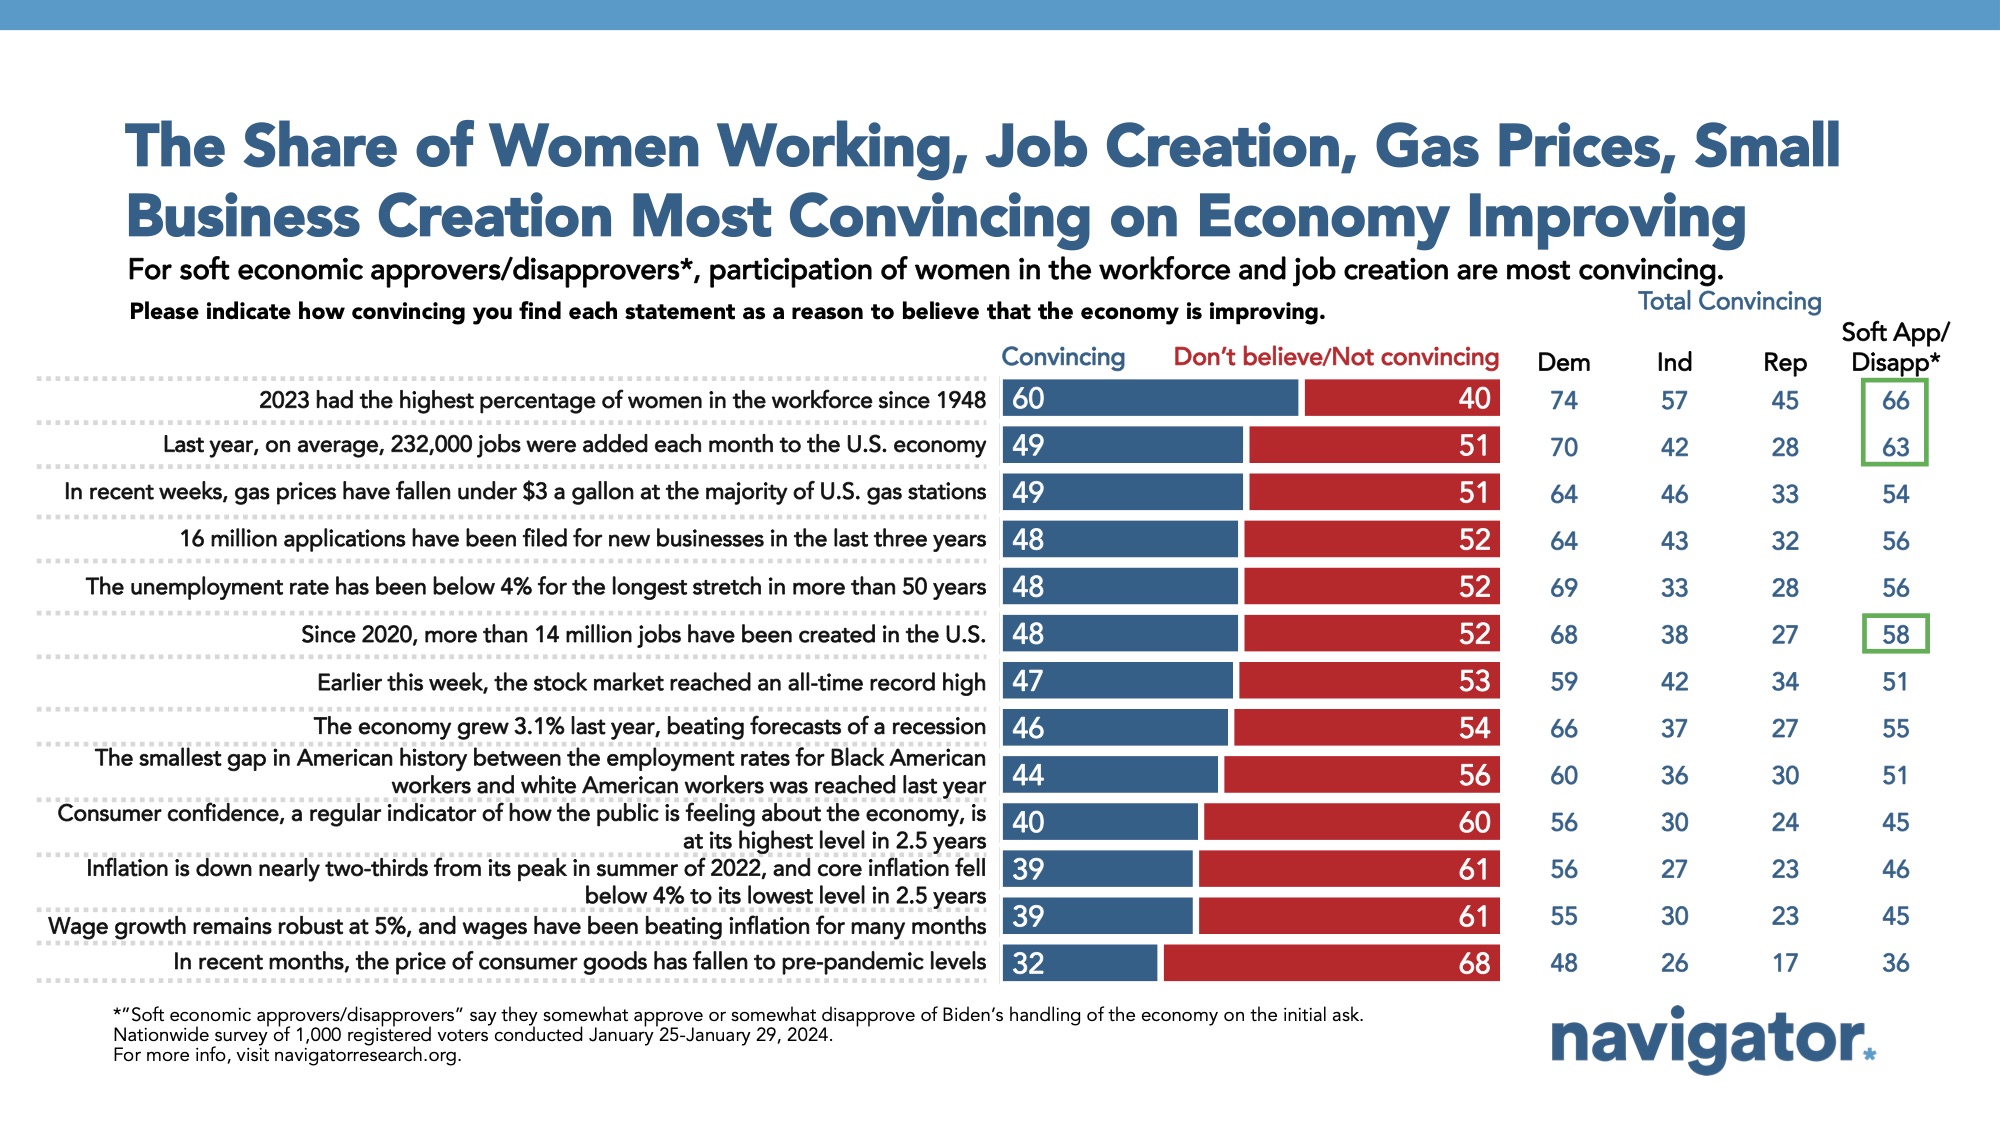
The most convincing evidence of an improving economy is the high participation of women in the workforce, job creation, and gas prices.
Among a list of statements about economic improvement, the most convincing reasons to believe the economy is improving include that “2023 had the highest percentage of women in the workforce since 1948” (60 percent convincing overall, including 66 percent convincing among those who say they somewhat approve or somewhat disapprove of President Biden’s handling of the economy), that “last year, on average, 232,000 jobs were added each month to the U.S. economy” (49 percent convincing overall, including 63 percent convincing among those who say they somewhat approve or somewhat disapprove of President Biden’s handling of the economy), and that “since 2020, more than 14 million jobs have been created in the U.S.” (48 percent convincing overall, including 58 percent convincing among those who say they somewhat approve or somewhat disapprove of President Biden’s handling of the economy).
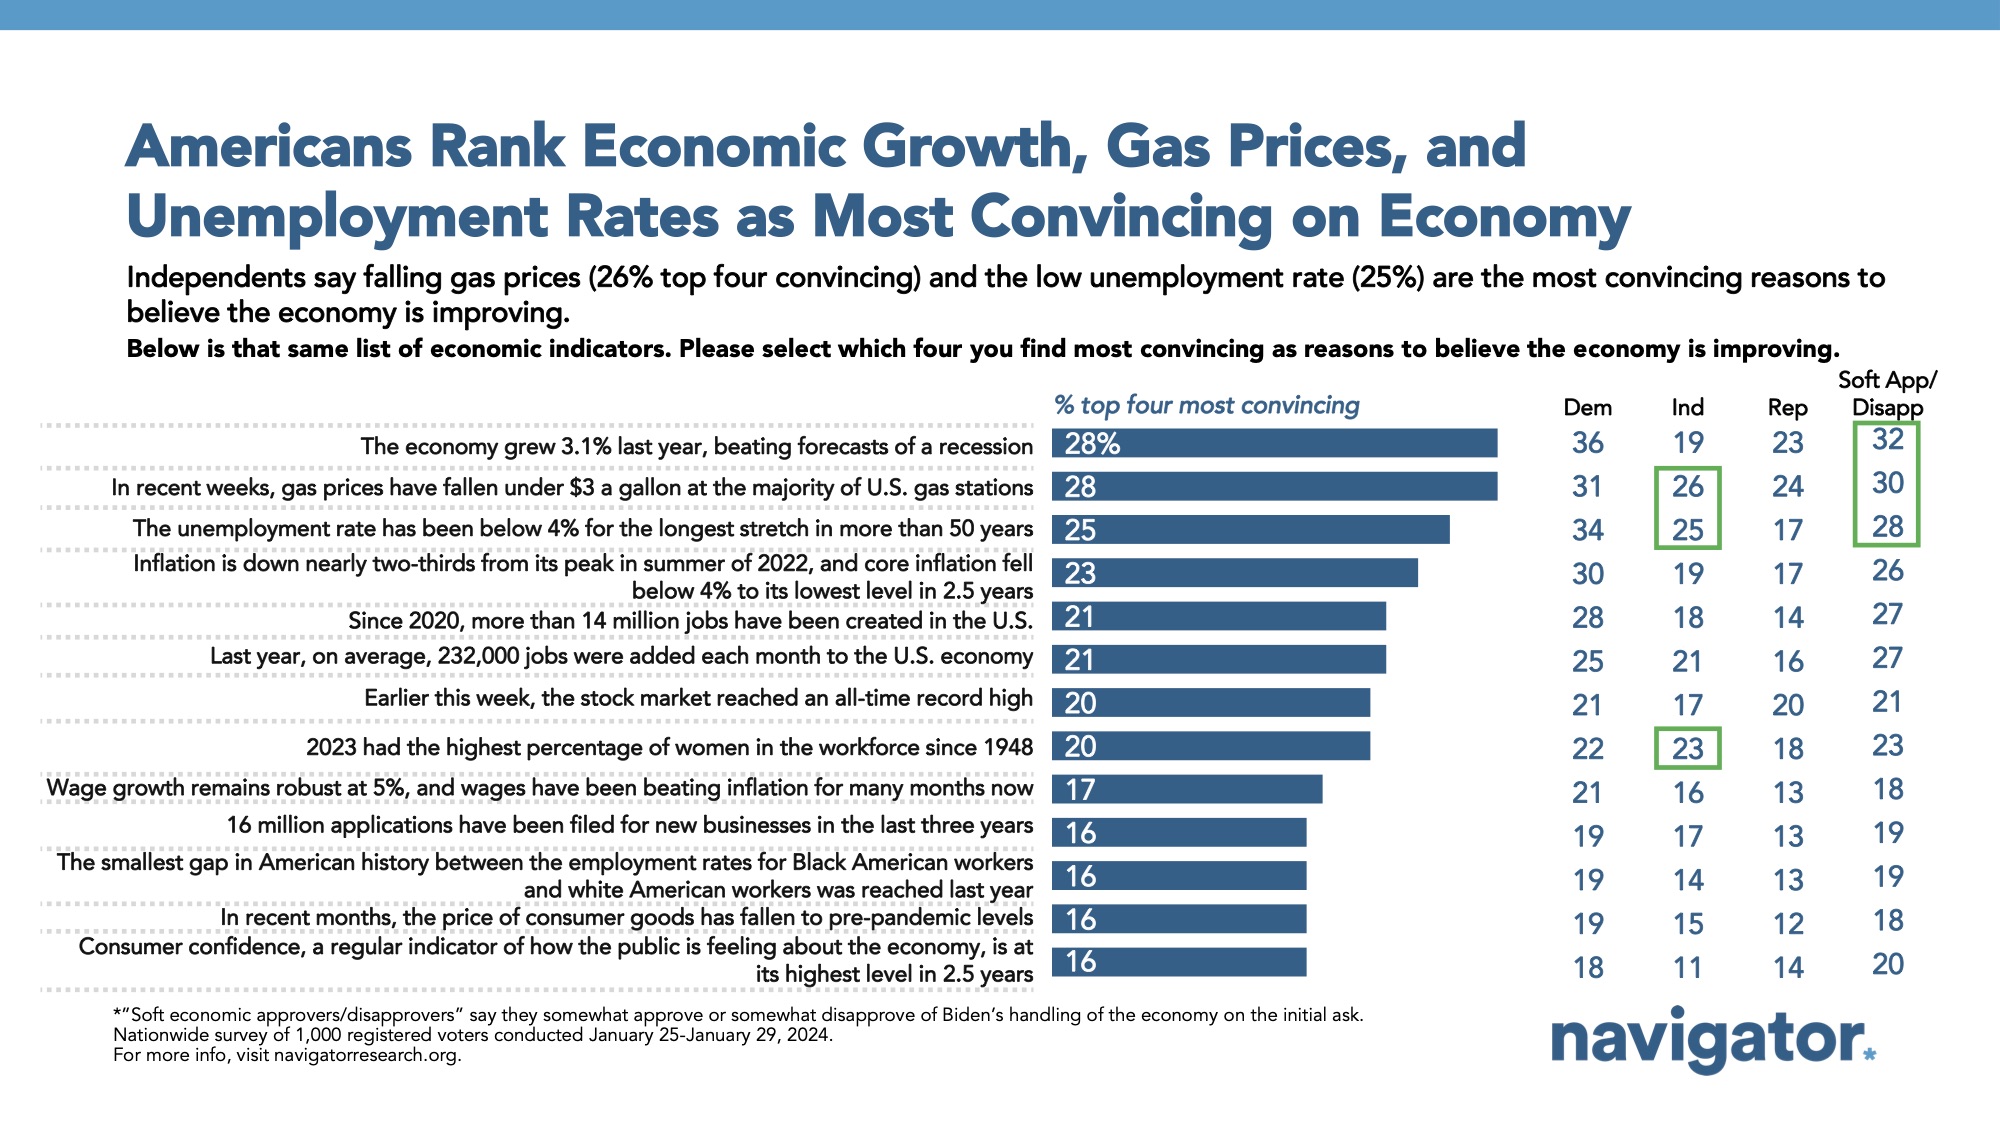
- In a follow up, Americans select economic growth (28 percent), gas prices falling (28 percent), and the low unemployment rate (25 percent) as the most convincing reasons to believe the economy is improving. Independents are most likely to select falling gas prices (26 percent) and low unemployment (25 percent).
After reading about improving economic metrics, almost one in ten grow more positive in their views of the economy.
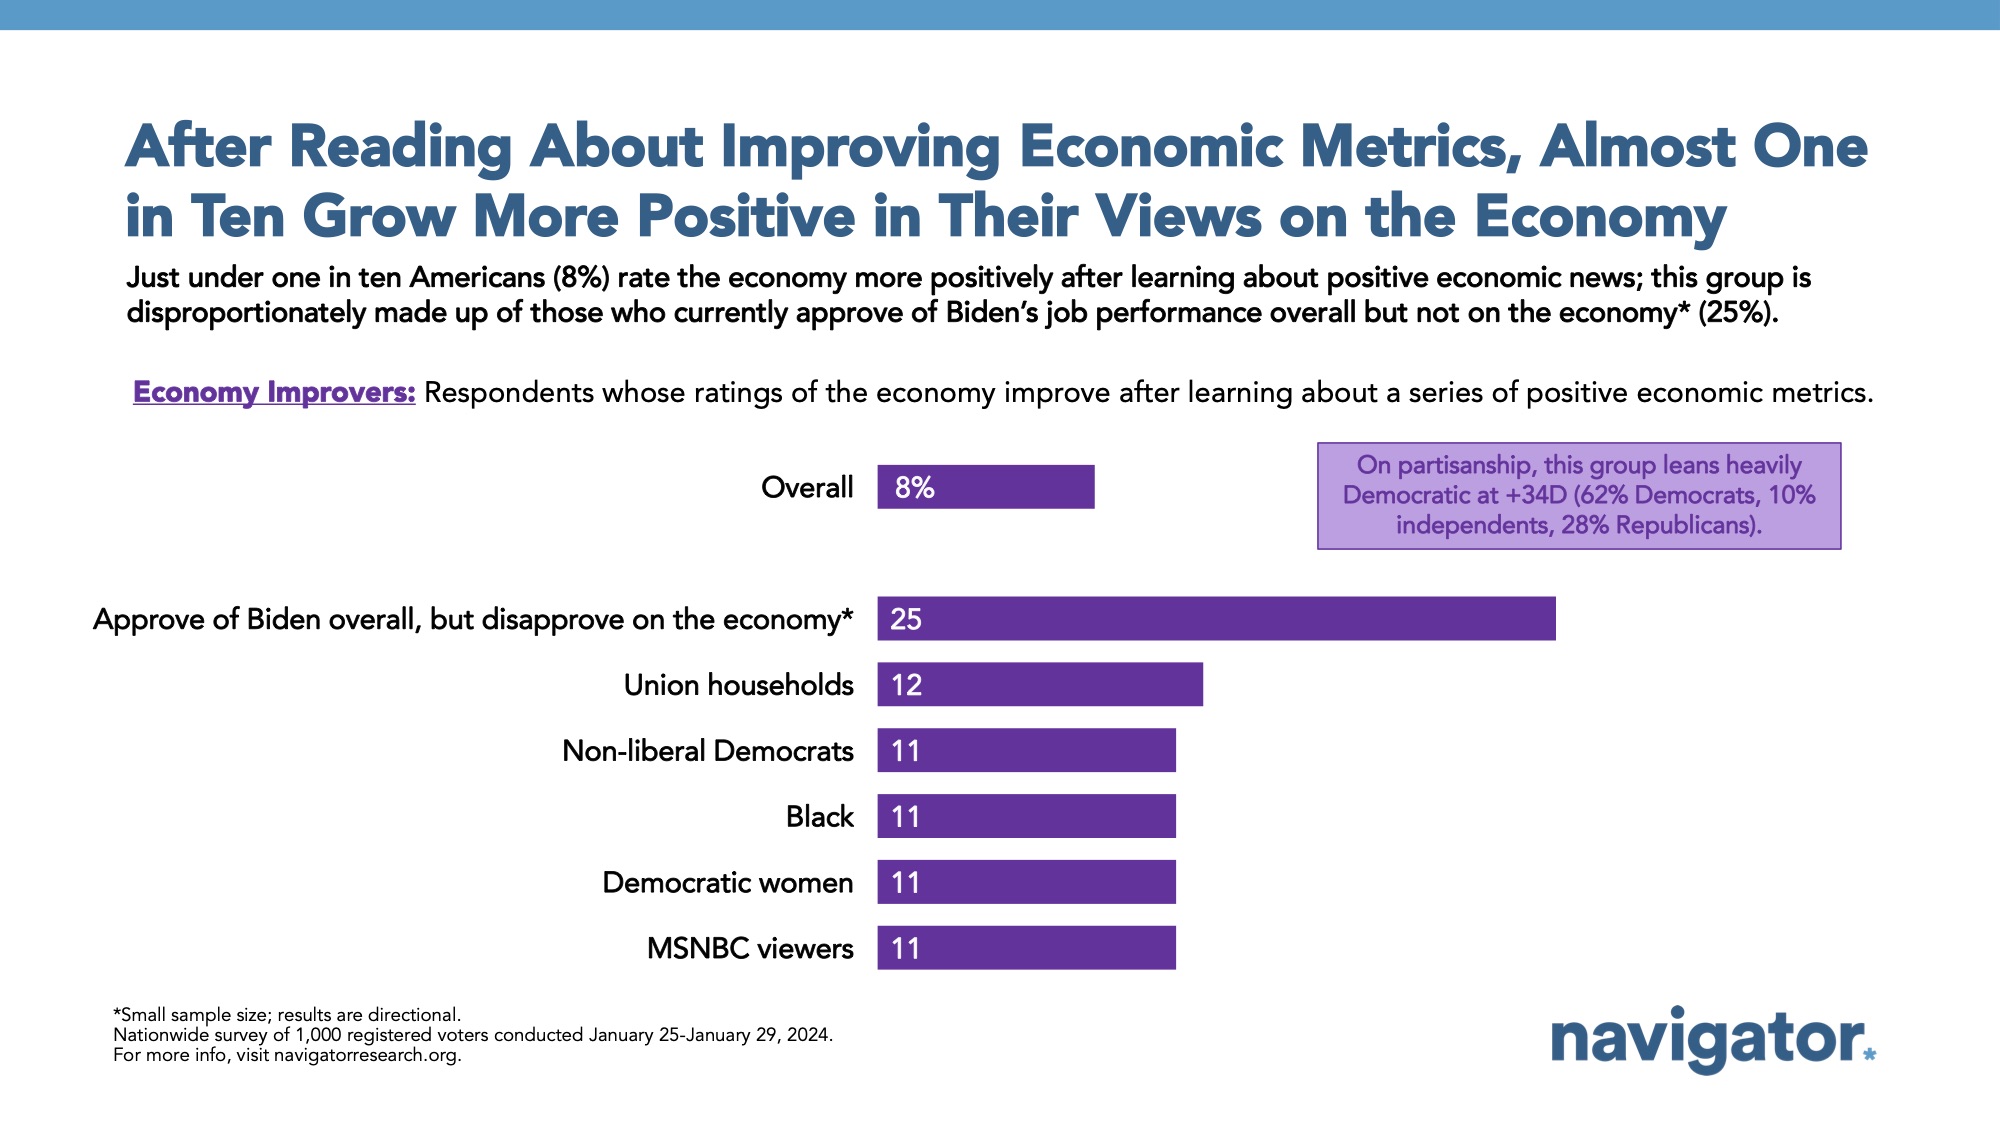
8 percent of Americans rate the economy more positively after learning positive economic news. This group is largely composed of self-identified Democrats (D+34; 62 percent Democrat – 10 percent independent – 28 percent Republican) and groups that are more likely to fall into this category include those who approve of Biden overall, but disapprove of his handling of the economy (25 percent), union households (12 percent), non-liberal Democrats (11 percent), Black Americans (11 percent), Democratic women (11 percent), and MSNBC viewers (11 percent).
About The Study
Global Strategy Group conducted public opinion surveys among a sample of 1,000 registered voters from January 25-January 29, 2024. 100 additional interviews were conducted among Hispanic voters. 75 additional interviews were conducted among Asian American and Pacific Islander voters. 100 additional interviews were conducted among African American voters. 100 additional interviews were conducted among independent voters. The survey was conducted online, recruiting respondents from an opt-in online panel vendor. Respondents were verified against a voter file and special care was taken to ensure the demographic composition of our sample matched that of the national registered voter population across a variety of demographic variables.
