Poll: The Presidential Debate & The Parties
This Navigator Research report contains polling data on perceptions of the political landscape, including reactions to the presidential debate, and what Americans perceive as Congress’ primary focus.
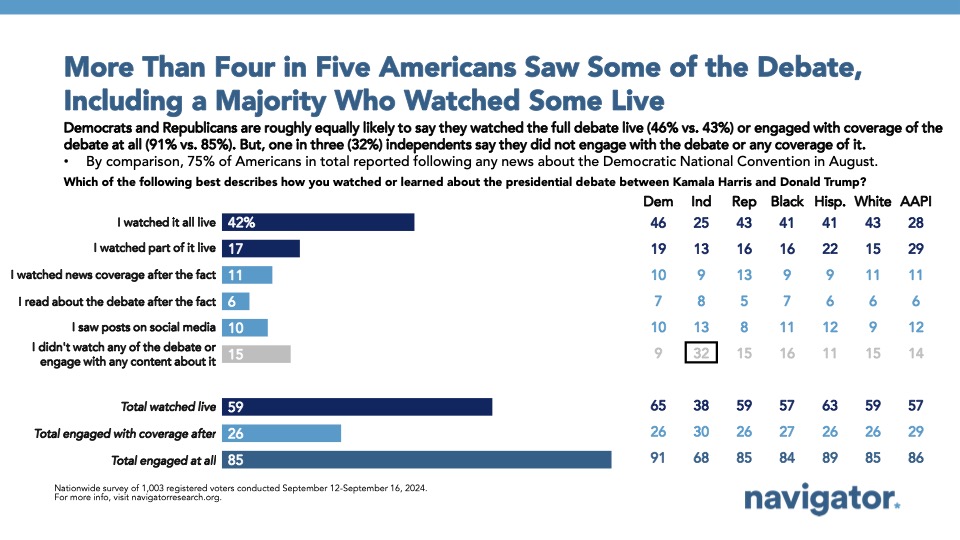
More than four in five Americans engaged with the debate in some way.
More than four in five Americans saw something about the presidential debate, with more than half watching all or part of it live. 85 percent of Americans say they engaged with the debate in some way (59 percent watched part of all of it live – 26 percent watched, read, or saw news about it – 15 percent did not watch or engage with news at all). More people saw some of the debate live than the DNC Convention (40 percent) and President Biden’s State of the Union address (35 percent).
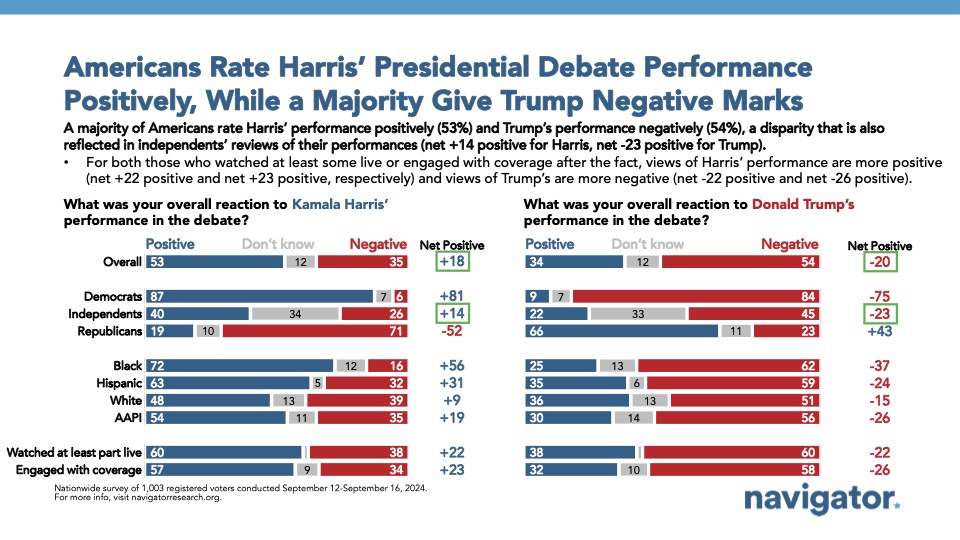
- A majority of those who engaged with the debate (either live or from news coverage) reacted positively to Kamala Haris’ performance (net +22; 59 percent positive – 37 percent negative) while Trump’s performance ratings are the mirror image in negative territory.(net – 24; 36 percent positive – 60 percent negative). A plurality of independents viewed Harris’ performance positively (net +14; 40 percent positive – 26 percent negative), and Trump’s performance negatively (net -23; 22 percent positive – 45 percent negative).
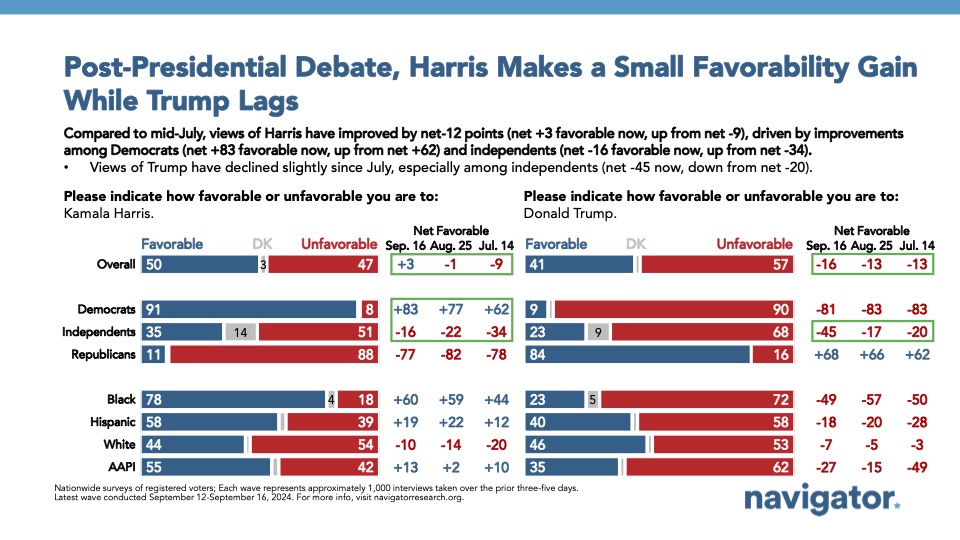
Vice President Harris’ favorability has grown following the debate, while former President Trump’s is underwater by double-digits.
Harris is viewed favorably by half of Americans (net +3; 50 percent favorable – 47 percent unfavorable), a 10-point increase in favorability since June (40 percent favorable – 54 percent unfavorable). The increase in popularity largely comes from Democrats (from net +56 to net +83), as well as movement among independents (from net -36 to net -16). Trump’s favorability is 16 points upside down (41 percent favorable – 57 percent unfavorable), as he lost ground among independents (from net -30 to net -45 now; 23 percent favorable – 68 percent unfavorable).
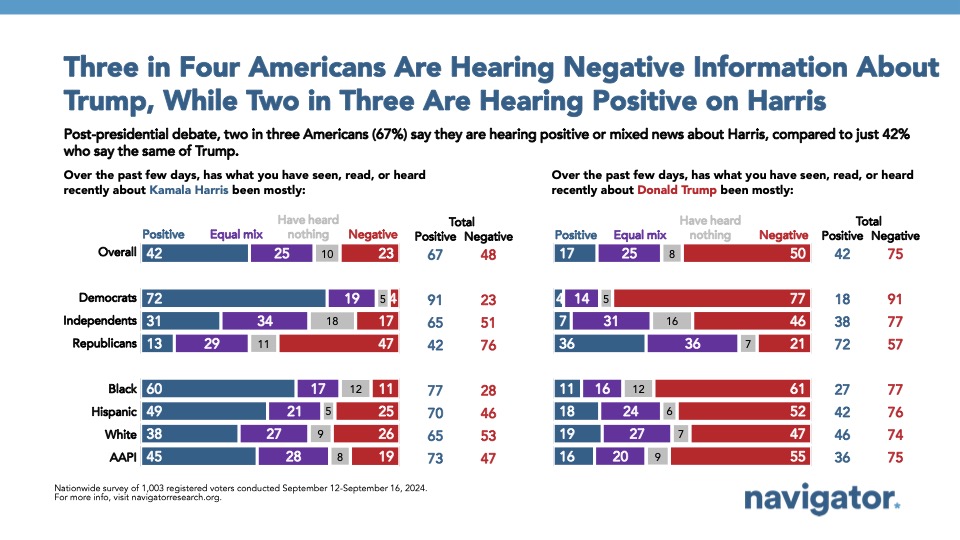
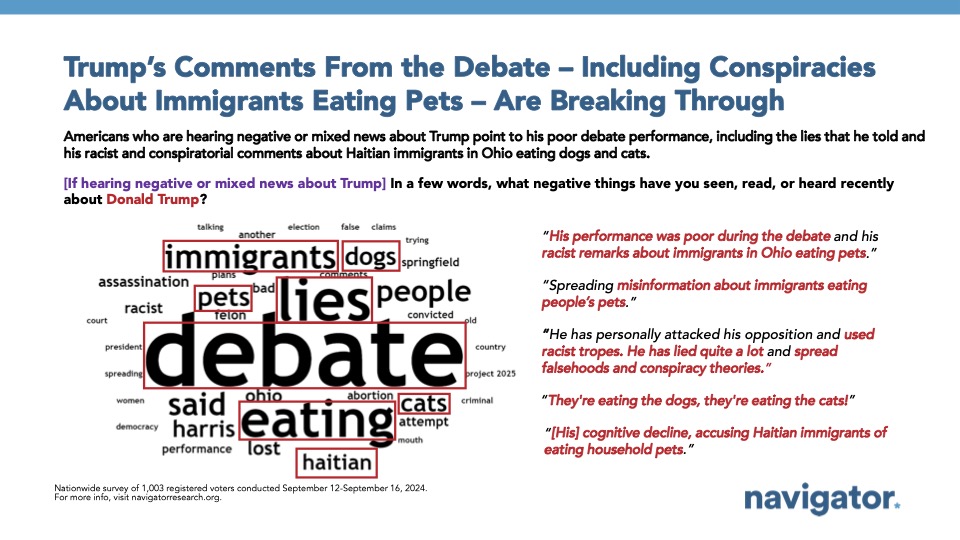
- Over the past few days, three in four Americans have seen, read, or heard, “a lot” or “some” about former President Donald Trump (77 percent) and Vice President Harris (75 percent). 50 percent say that the news about Trump has been mostly negative, while a plurality have heard mostly positive news about Harris (42 percent).
A majority of Americans continue to feel that inflation is the most important priority for Congress.
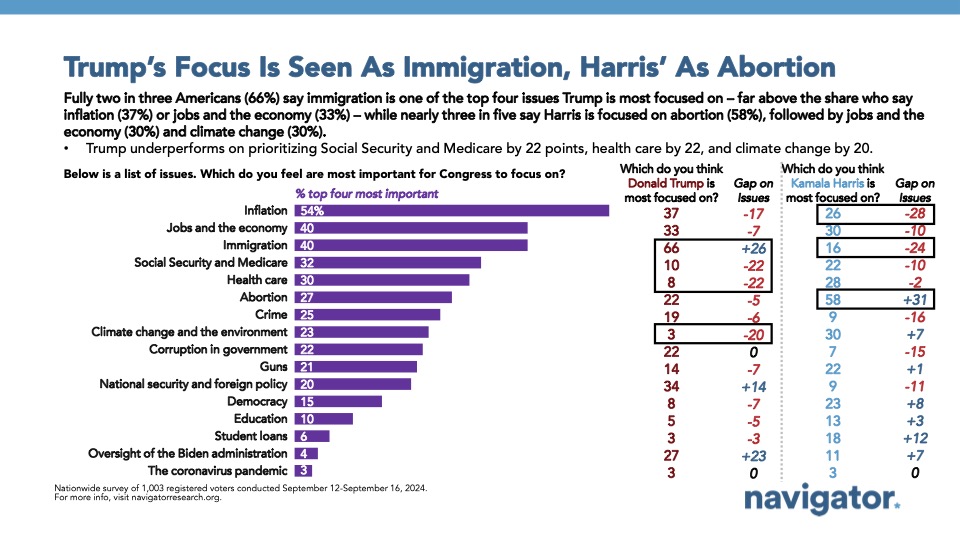
54 percent of Americans say that inflation should be a priority for Congress, including 64 percent of Republicans, 56 percent of independents, and 44 percent of Democrats. Behind inflation, independents prioritize jobs and the economy (47 percent), while Republicans prioritize immigration (63 percent), and Democrats prioritize abortion (41 percent).
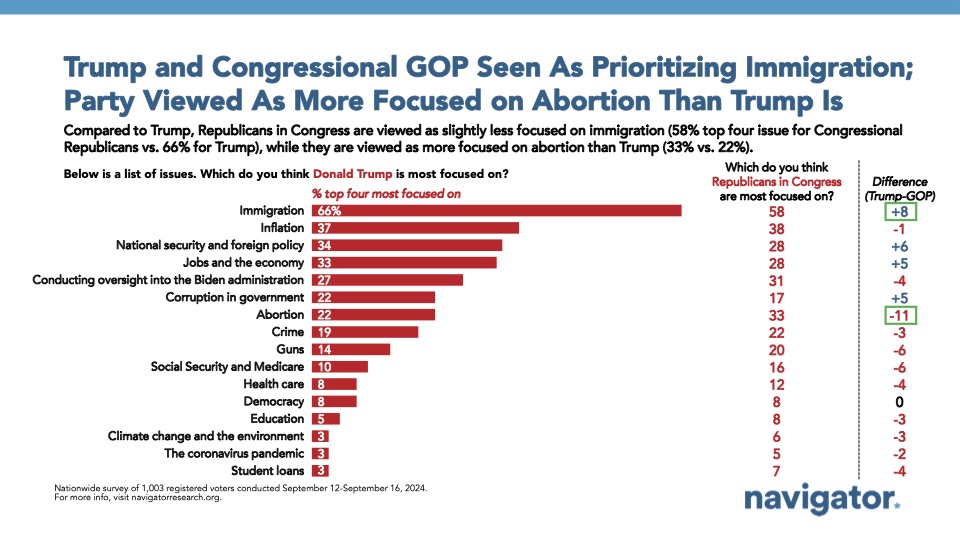
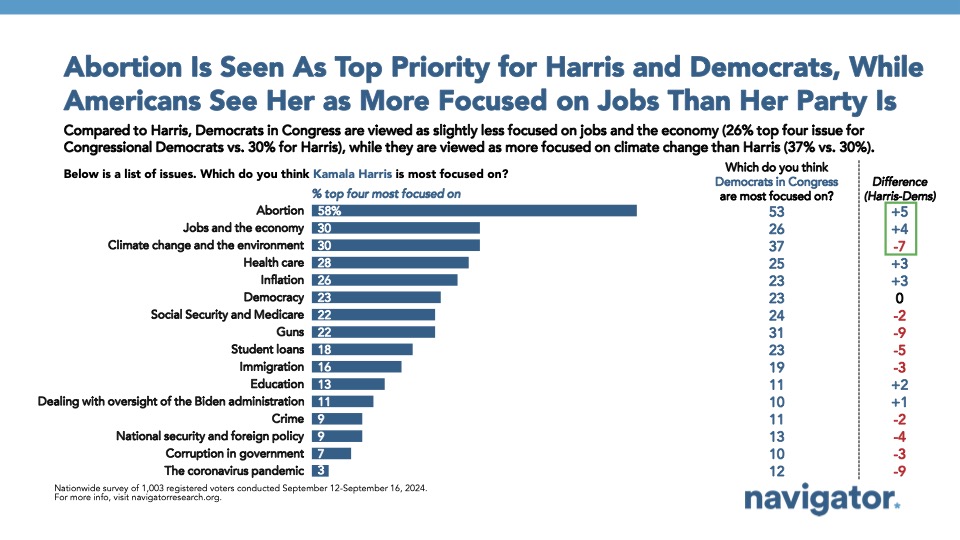
- 58 percent of Americans believe that Congressional Republicans are most focused on immigration, while Congressional Democrats are most focused on abortion (53 percent). Similarly, Trump is seen as most focused on immigration (66 percent), while Harris is seen as most focused on abortion (58 percent).
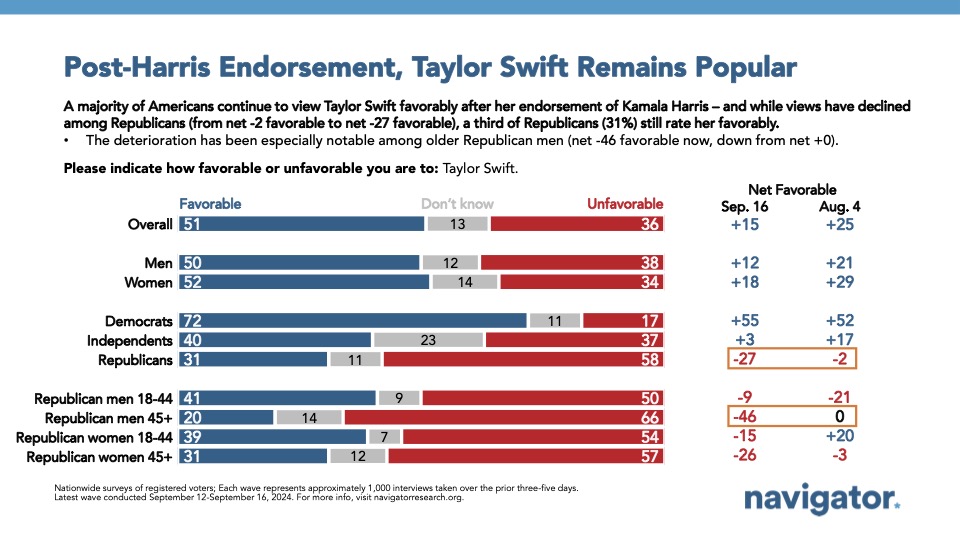
Bonus Finding: Post-Harris endorsement, Taylor Swift remains popular.
Following Taylor Swift’s endorsement of Vice President Harris, a majority of Americans continue to rate her favorably (net +15; 51 percent favorable – 36 percent unfavorable), however most Republicans rate Swift unfavorably (net -27), a 25-point swing since August (net -2). Unfavorability is most concentrated among Republican men over the age of 45 (net -46; 20 percent favorable – 66 percent unfavorable), while Republican men under the age of 45 are more divided (net -9; 41 percent favorable – 50 percent unfavorable).
About The Study
Global Strategy Group conducted a public opinion survey among a sample of 1,003 registered voters from September 12-September 16, 2024. 106 additional interviews were conducted among Hispanic voters. 76 additional interviews were conducted among Asian American and Pacific Islander voters. 100 additional interviews were conducted among African American voters. 106 additional interviews were conducted among independent voters. The survey was conducted online, recruiting respondents from an opt-in online panel vendor. Respondents were verified against a voter file and special care was taken to ensure the demographic composition of our sample matched that of the national registered voter population across a variety of demographic variables. The margin of error for the full sample at the 95 percent level of confidence is +/- 3.1 percentage points. The margin of error for subgroups varies and is higher.

