Poll: Personal Finance and the Economy
This Navigating the Battleground report contains polling data examining perceptions of the economy and the effects of rising costs on the personal finances of Americans in the battleground.
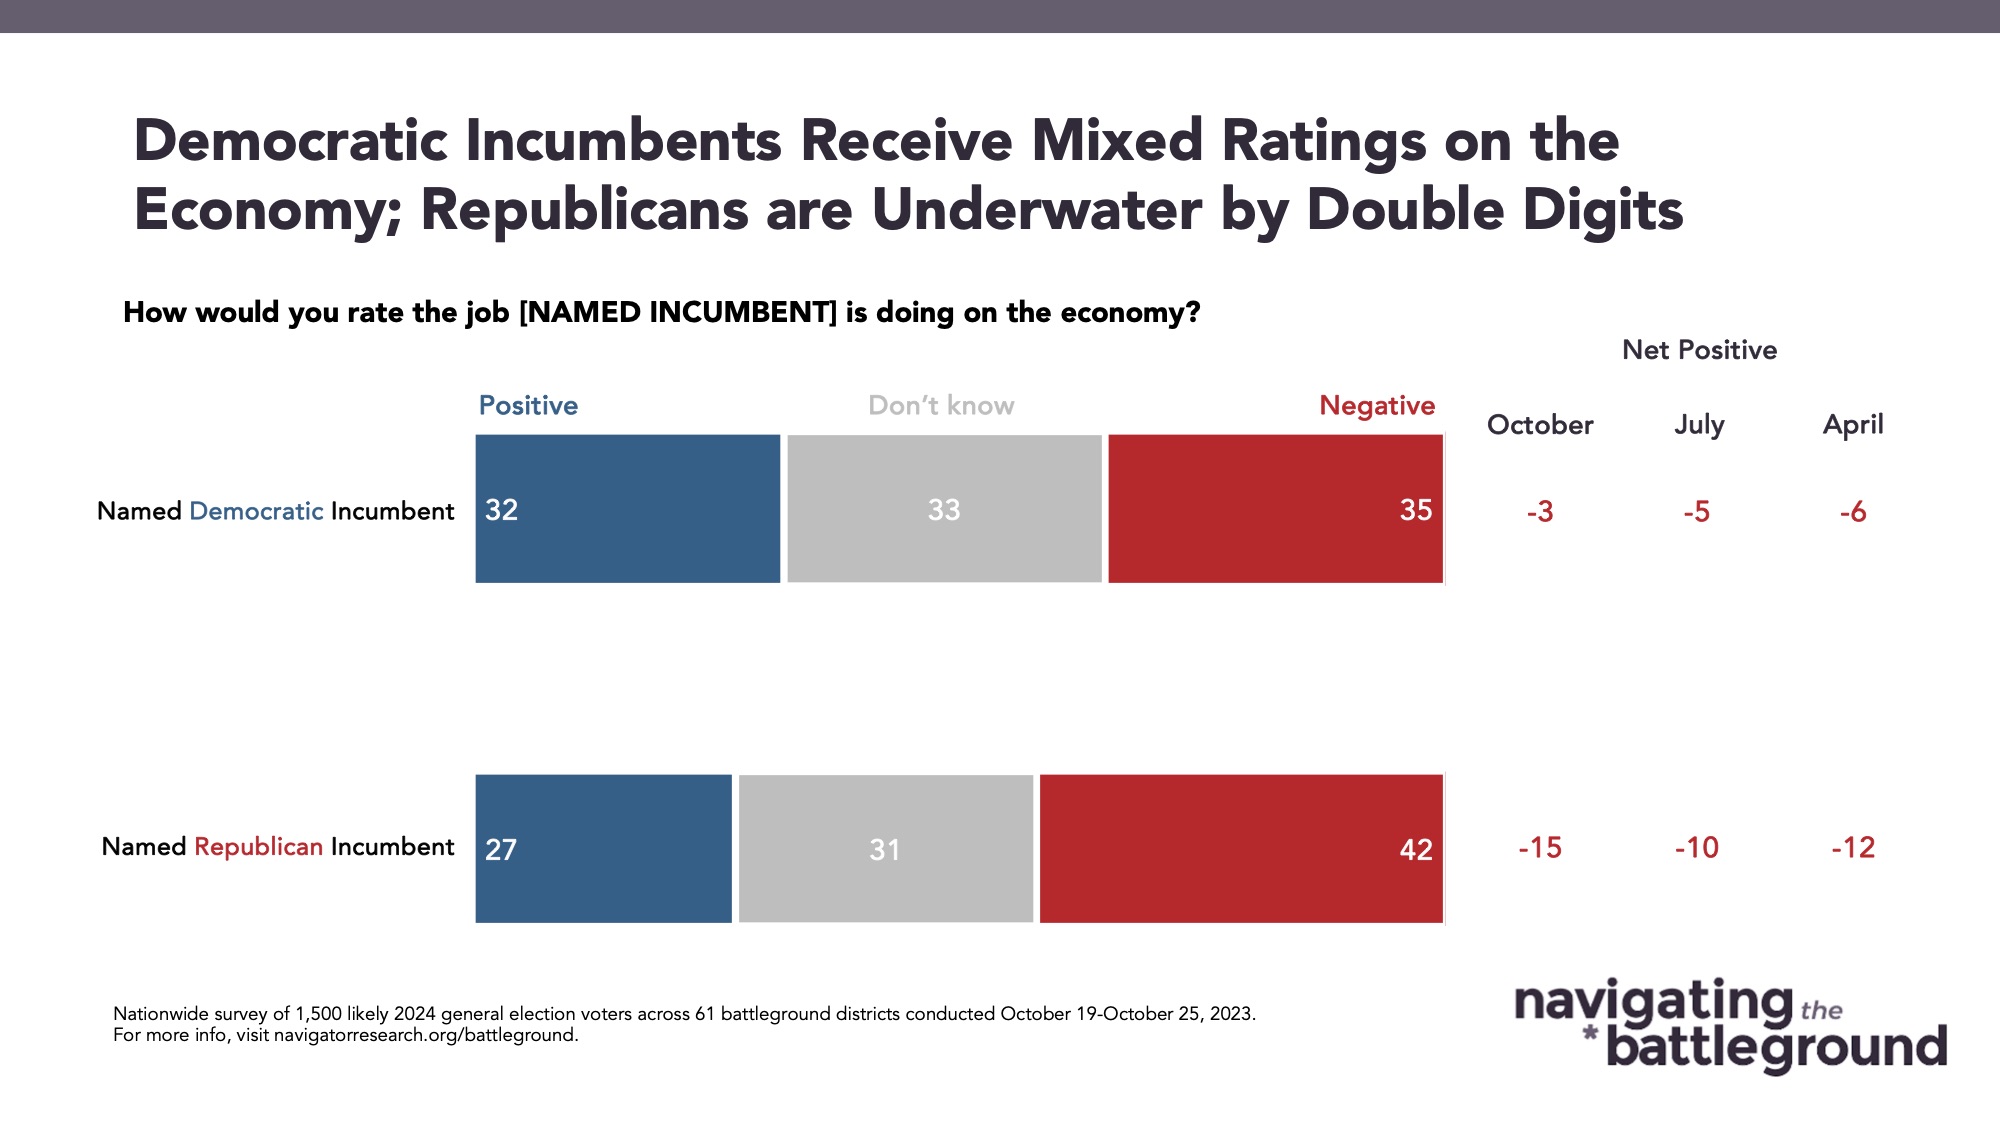
Republican incumbents trail behind their Democratic counterparts on economic job approval, dropping to their lowest ratings in our tracking.
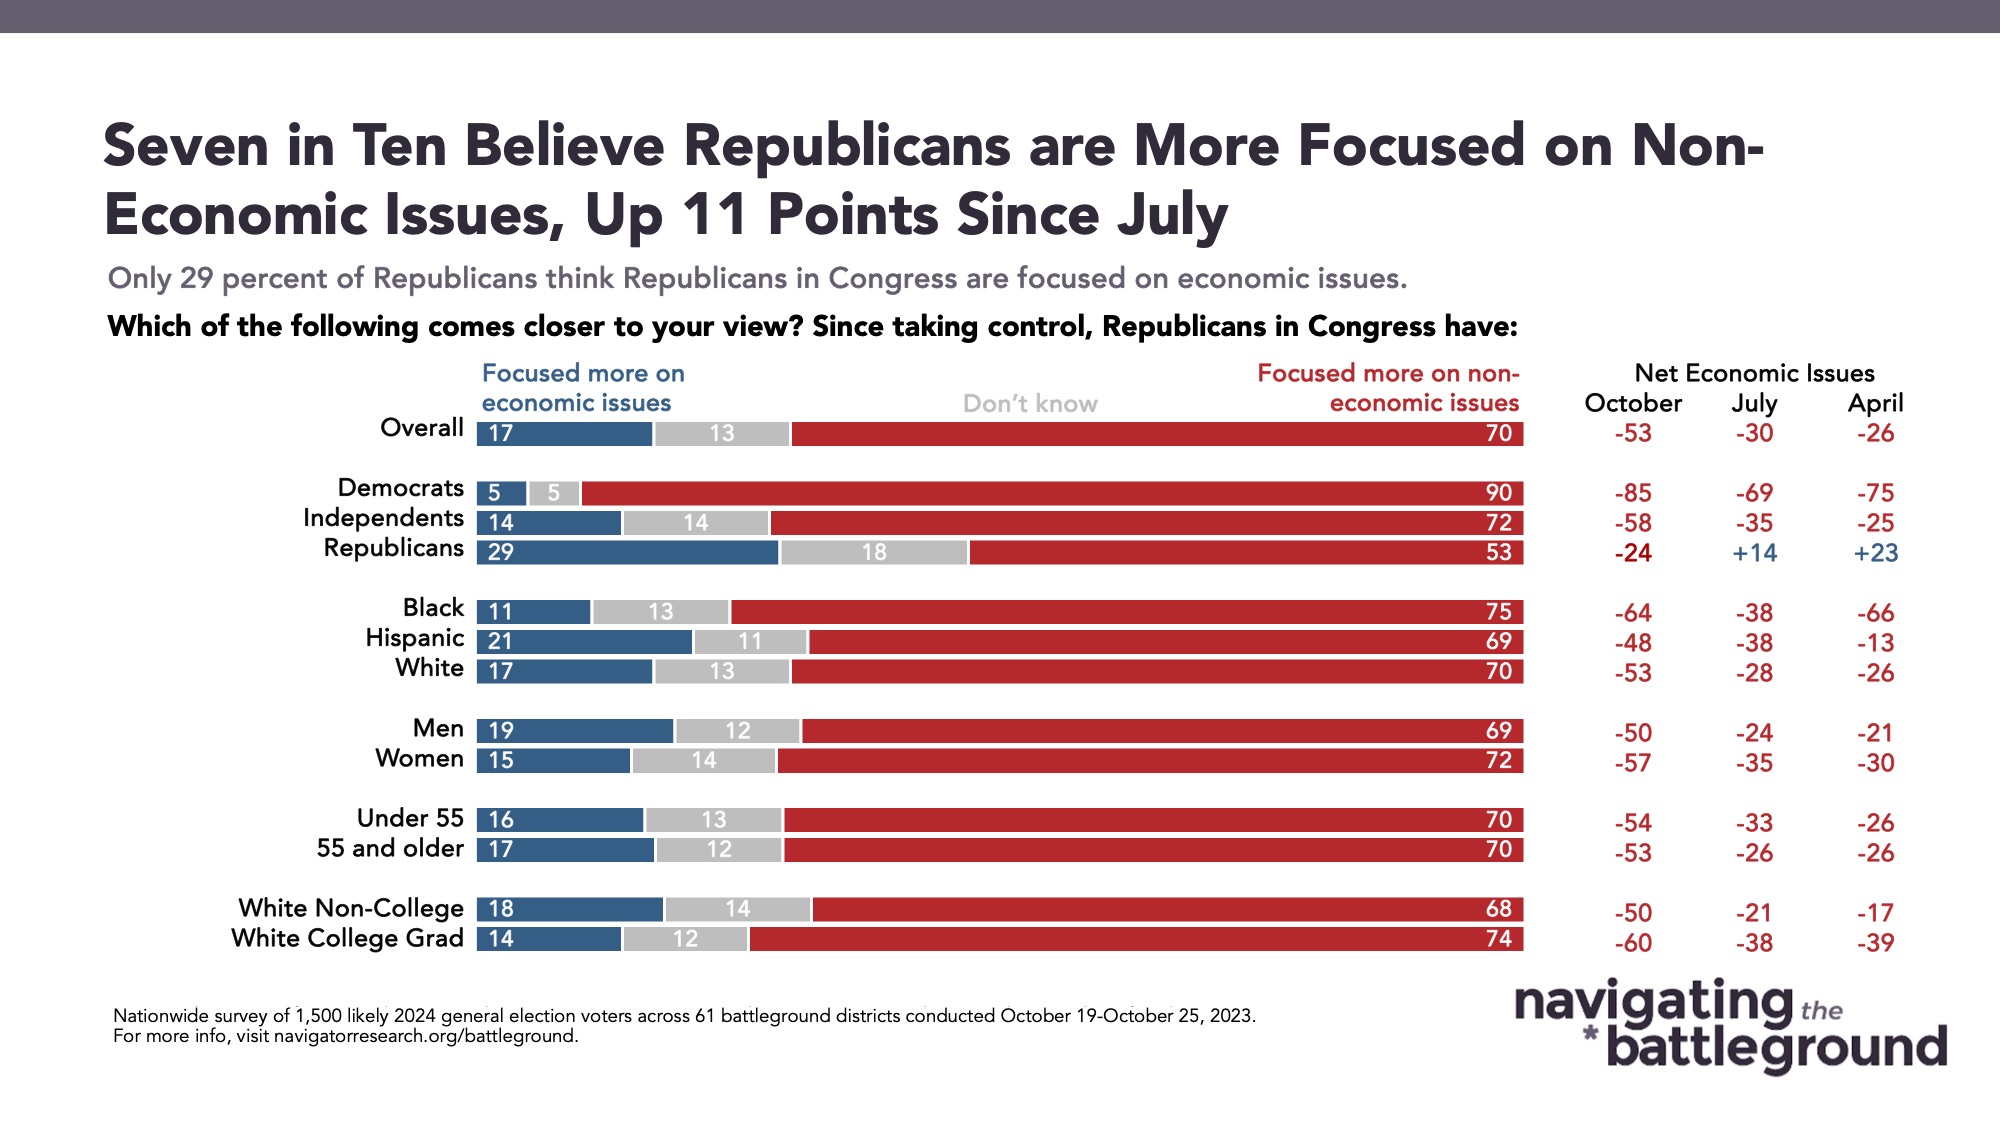
By a 15-point margin, battleground constituents rate their Republican incumbents negatively on the economy (27 percent positive – 42 percent negative). This is down a net 5 points from our previous survey in July where Republican incumbents were 10 points underwater (29 percent positive – 39 percent negative). Democratic incumbents, while still net negative on economic approval, are at their highest net approval on handling the economy in our tracking (net -3; 32 percent positive – 35 percent negative). The drop in economic approval for Republicans in Congress comes as there has been a significant drop in the share of battleground constituents believing they are prioritizing economic issues, from net -30 in July (29 percent focused more on economic issues – 59 percent focused more on non-economic issues) to net -53 now (17 percent focused more on economic issues – 70 percent focused more on non-economic issues).
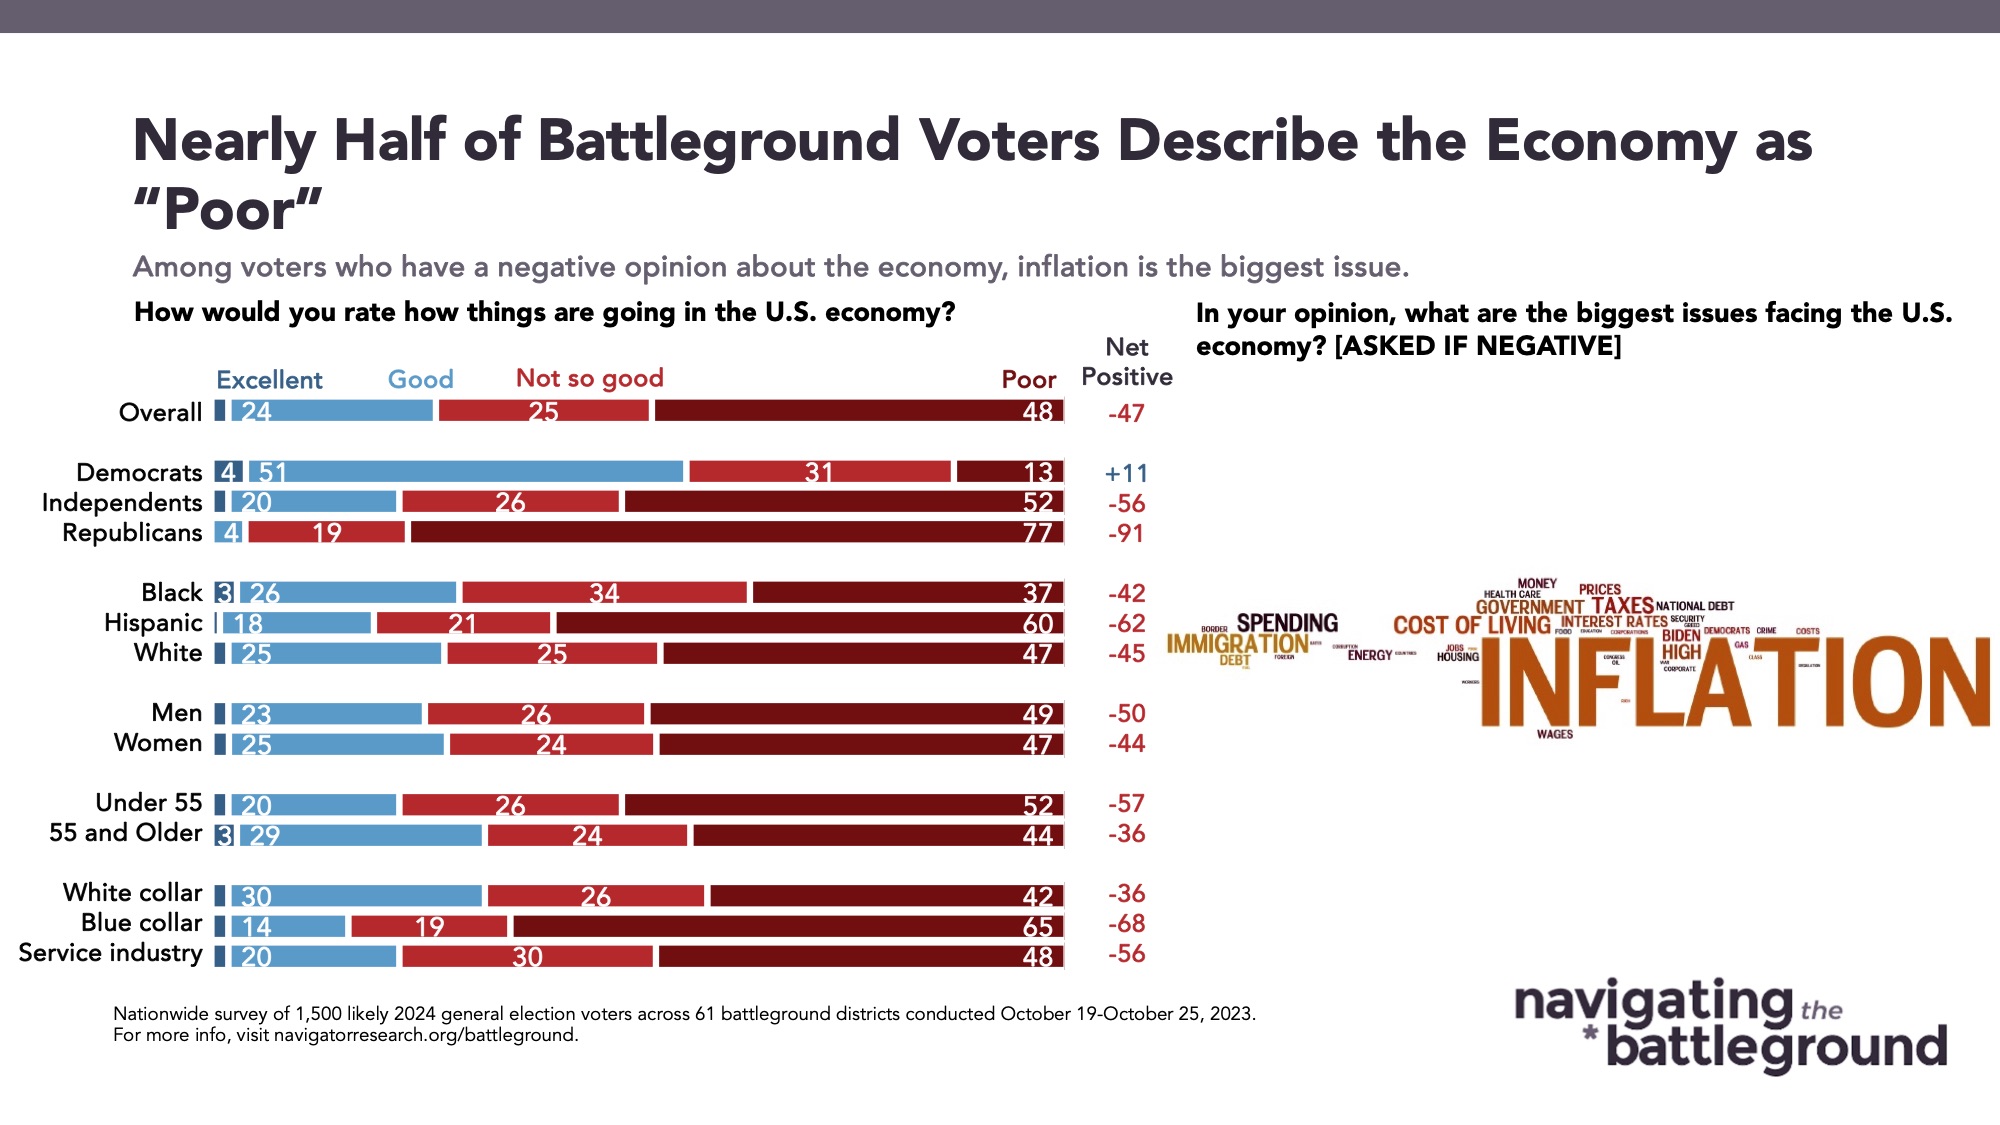
Battleground constituents are extremely pessimistic about the state of the economy.
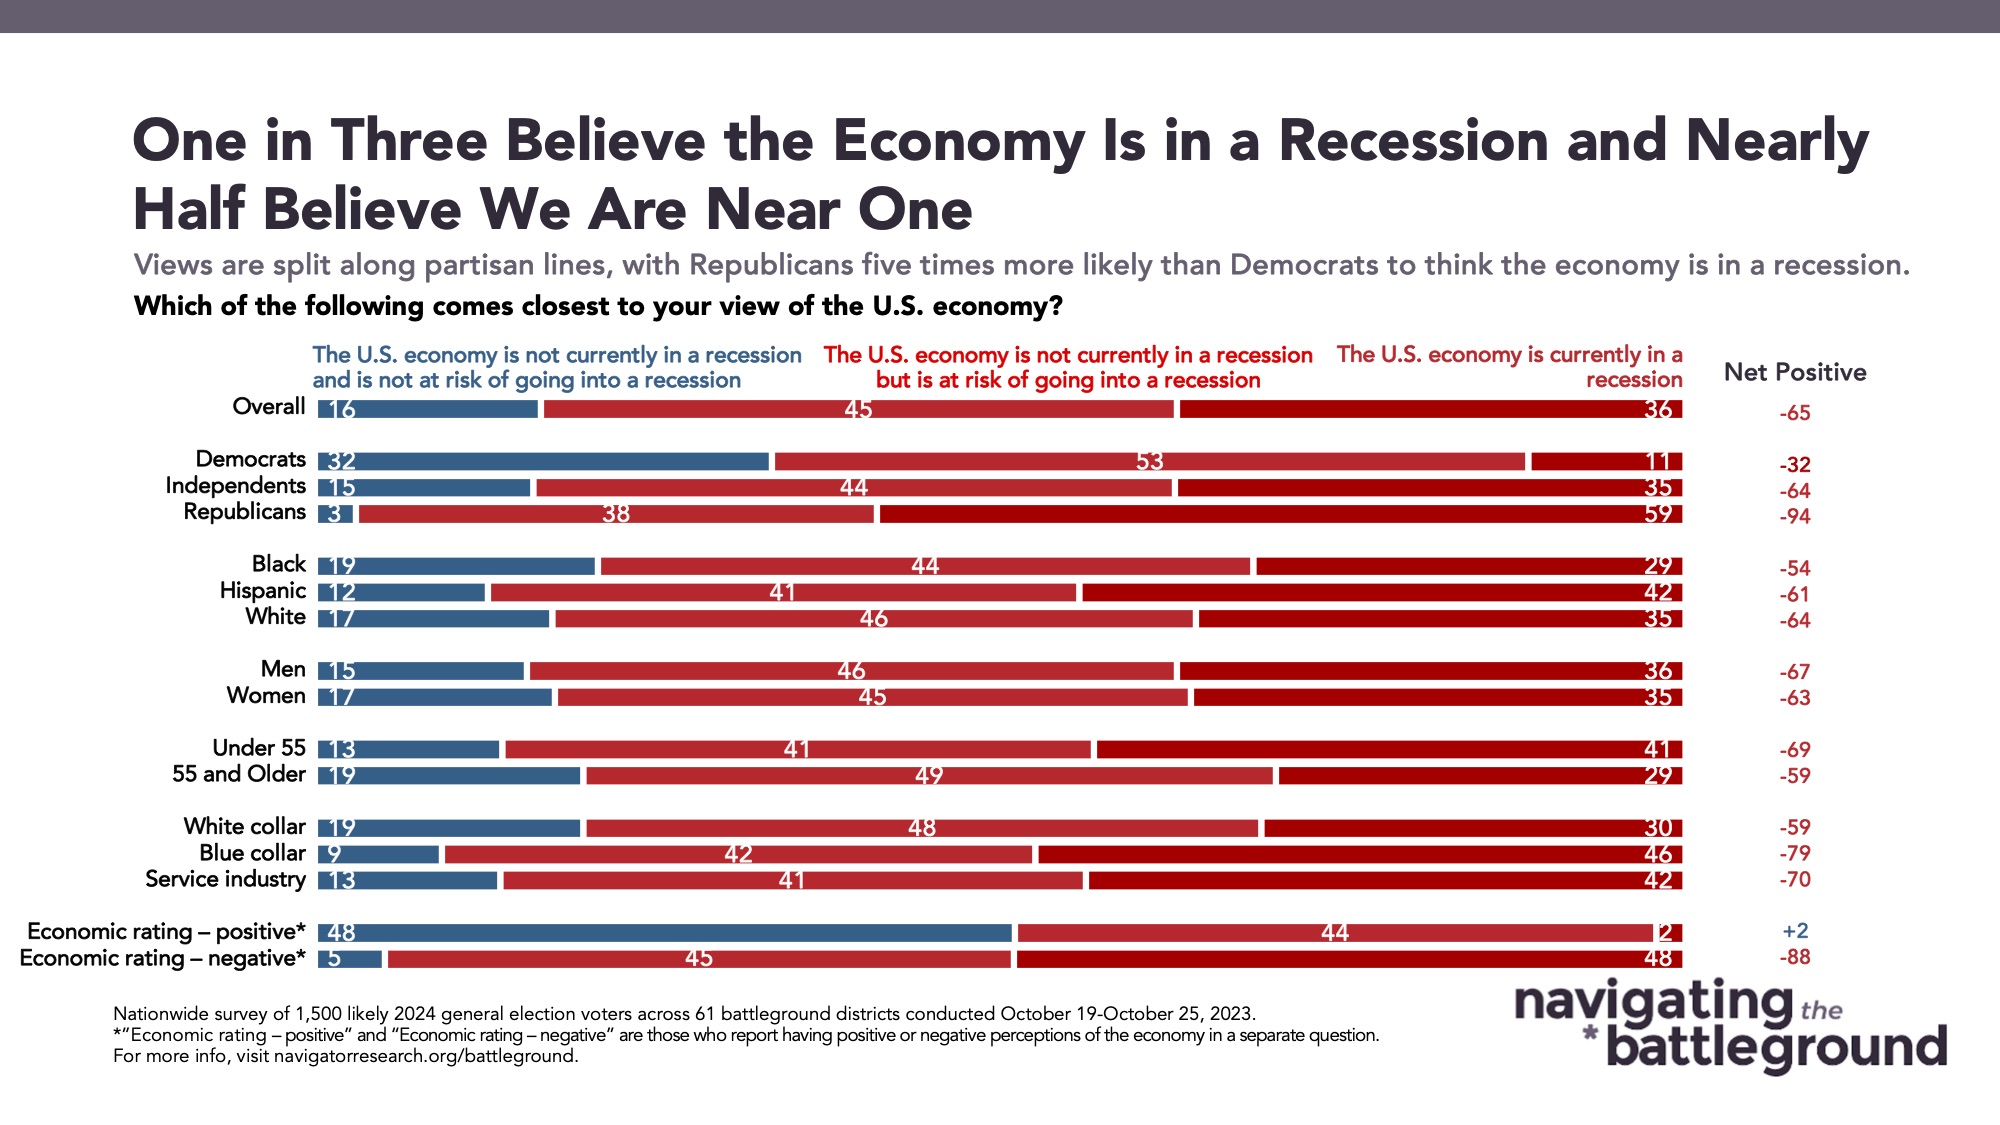
Seven in ten Americans in the battleground rate the economy negatively (73 percent), with nearly half of those in the battleground describing the U.S. economy as being “poor” (48 percent). Four in five battleground constituents (81 percent) believe that we are currently in a recession (36 percent) or heading toward a recession (45 percent). These negative views are particularly acute among those who are self-described blue collar and service industry workers: 84 percent of blue collar workers and 78 percent of those working the service industry rate the economy negatively, and 88 percent of blue collar workers and 83 percent of service industry workers believe the economy is currently in or at risk of going into recession.
A majority of voters say they are personally either barely making ends meet or aren’t at all.
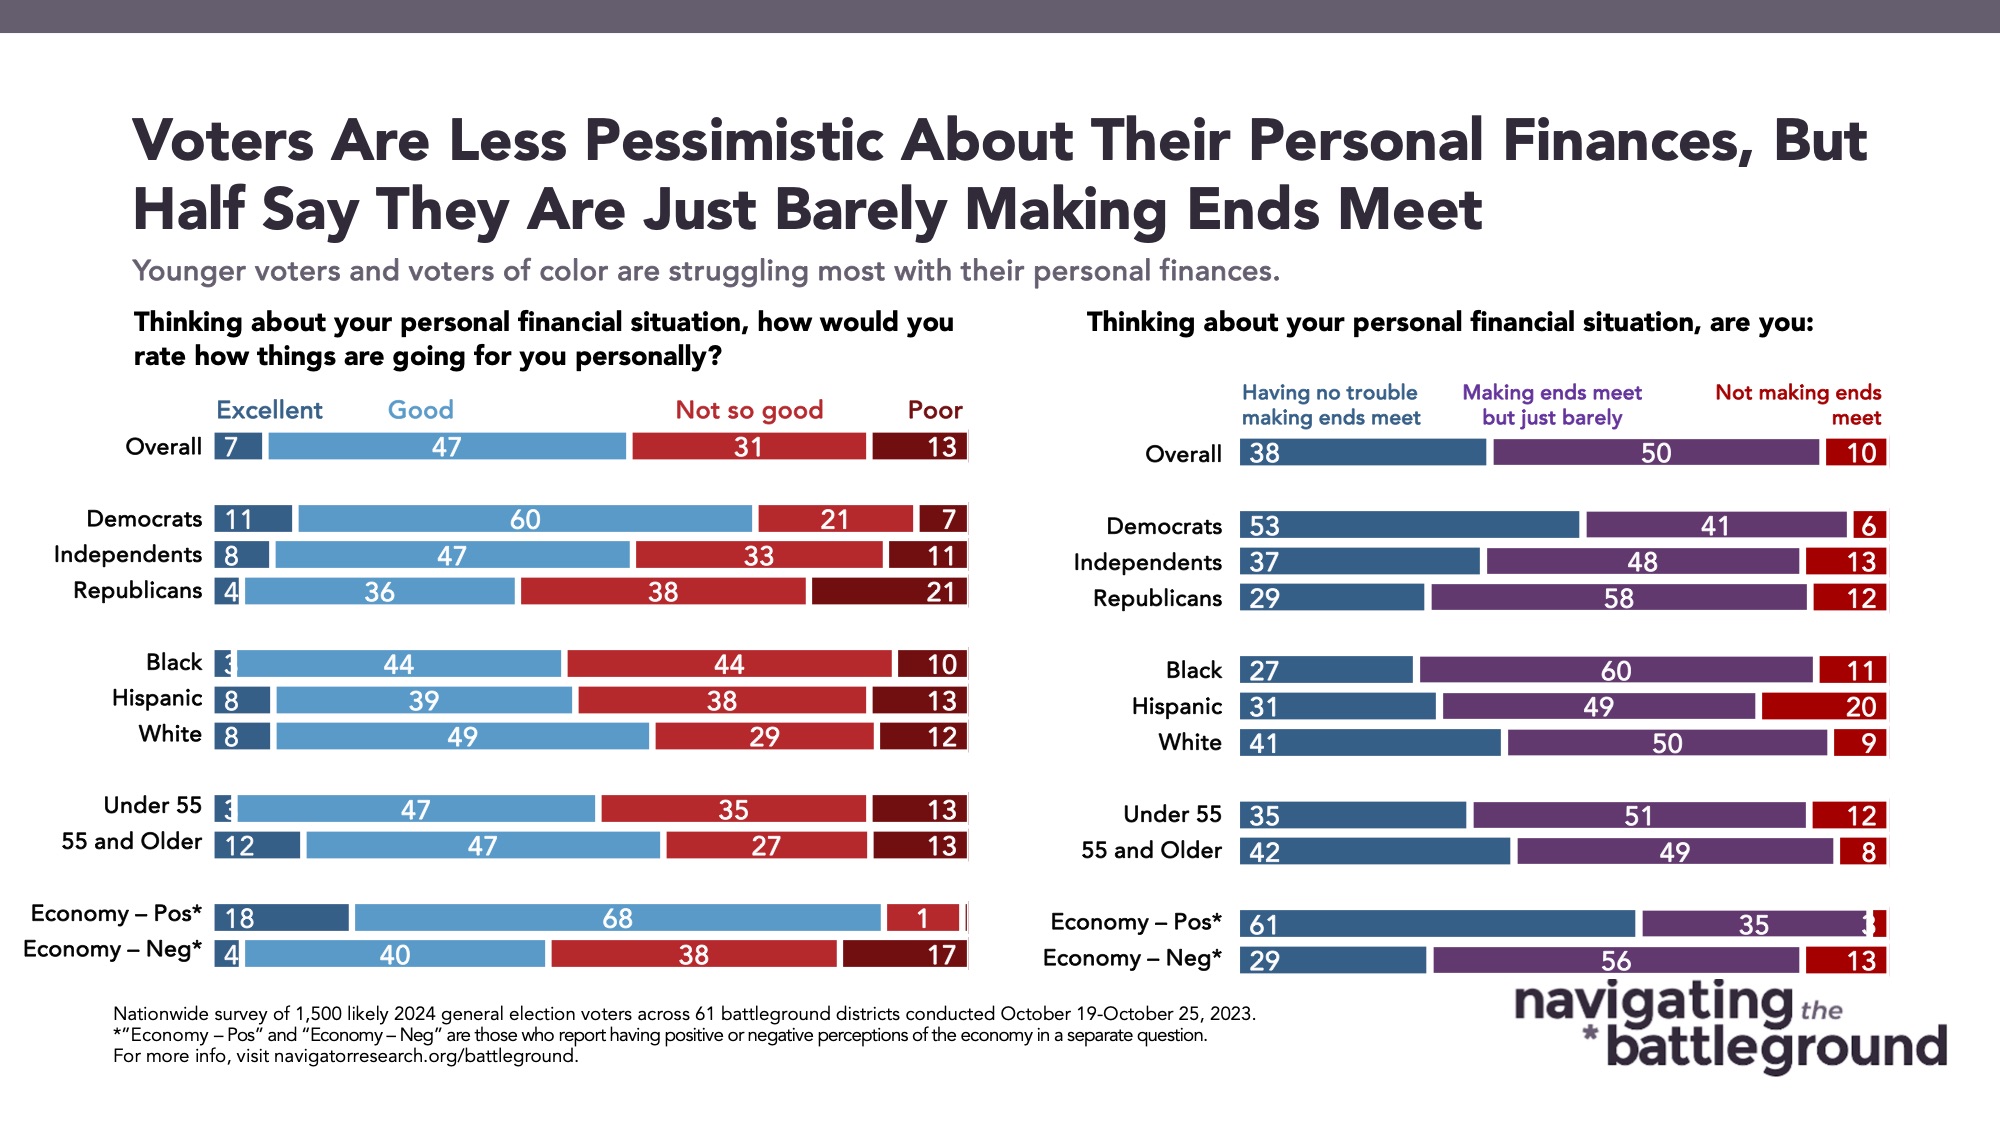
This negative sentiment about the national economy mirrors real struggles and anxieties those in the battleground are feeling in their personal financial situations. Three in five battleground constituents (60 percent) say they are “just barely making ends meet” (50 percent) or “not making ends meet” (10 percent). That share is even larger among blue collar workers in the battleground, of whom 74 percent say they’re “just barely making ends meet” (57 percent) or “not making ends meet” (17 percent). 81 percent of those living in households making less than $75,000 also say they’re struggling to make ends meet (61 percent just barely, 20 percent not making ends meet).
Americans in the battleground specifically cite future-oriented concerns as their most acute economic worry.
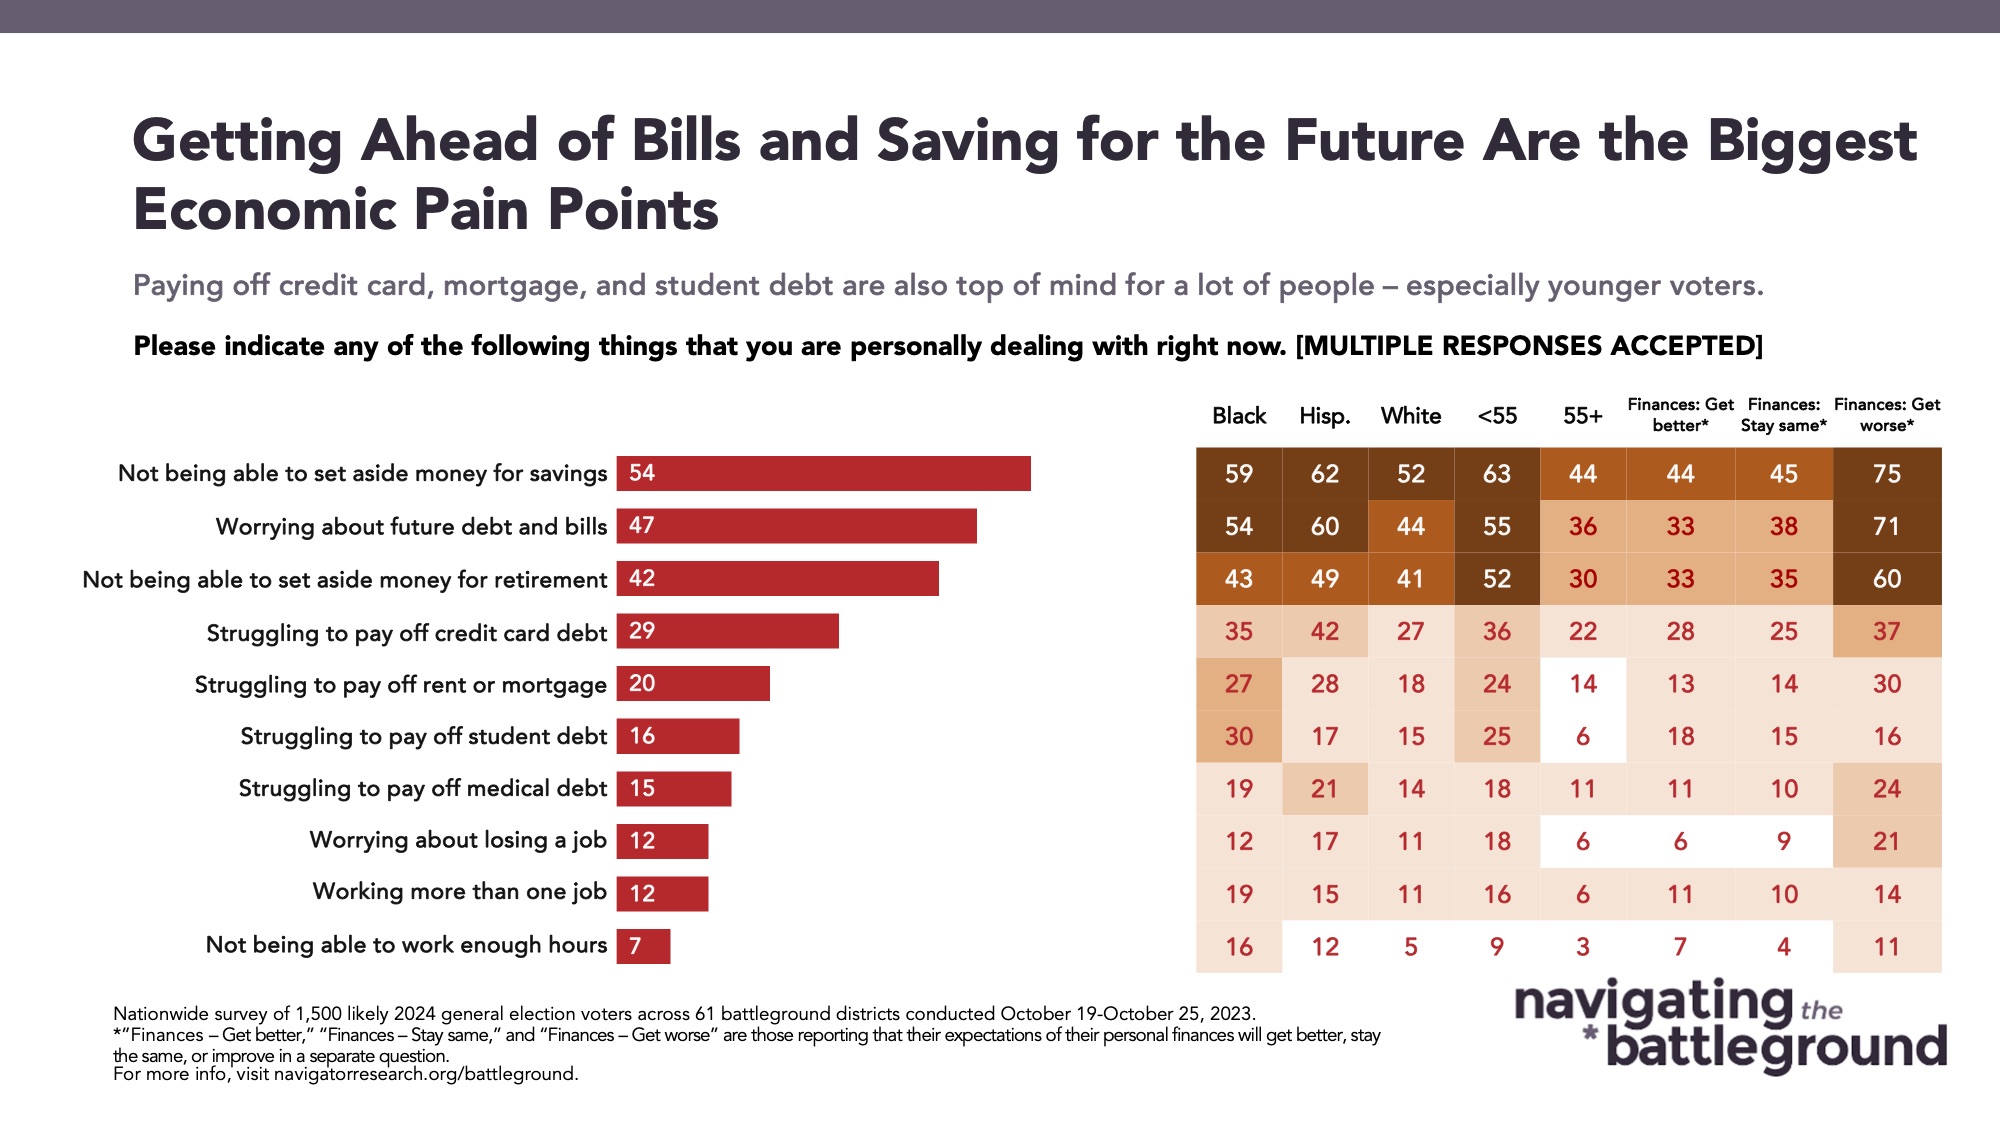
54 percent say they are “not able to set aside money for savings,” 47 percent say they’re “worrying about future debt and bills,” and 42 percent say they’re “not able to set aside money for retirement.” These pain points are particular struggles for younger Americans in the battleground under the age of 35 (62 percent are not able to set aside money for savings, 56 percent are worried about future debt, and 49 percent are unable to put aside money for retirement) and for those who have blue collar jobs (61 percent are not able to set aside money for savings, 52 percent are worried about future debt, and 51 percent are unable to put aside money for retirement). Concerns about job security fall to the bottom of the list of concerns: only 12 percent of battleground Americans are worried about losing their jobs and only 7 percent say they are concerned about “not being able to work enough hours.”
Food and gas, housing, and consumer good prices are the leading indicators of a struggling economy for Americans in the battleground.
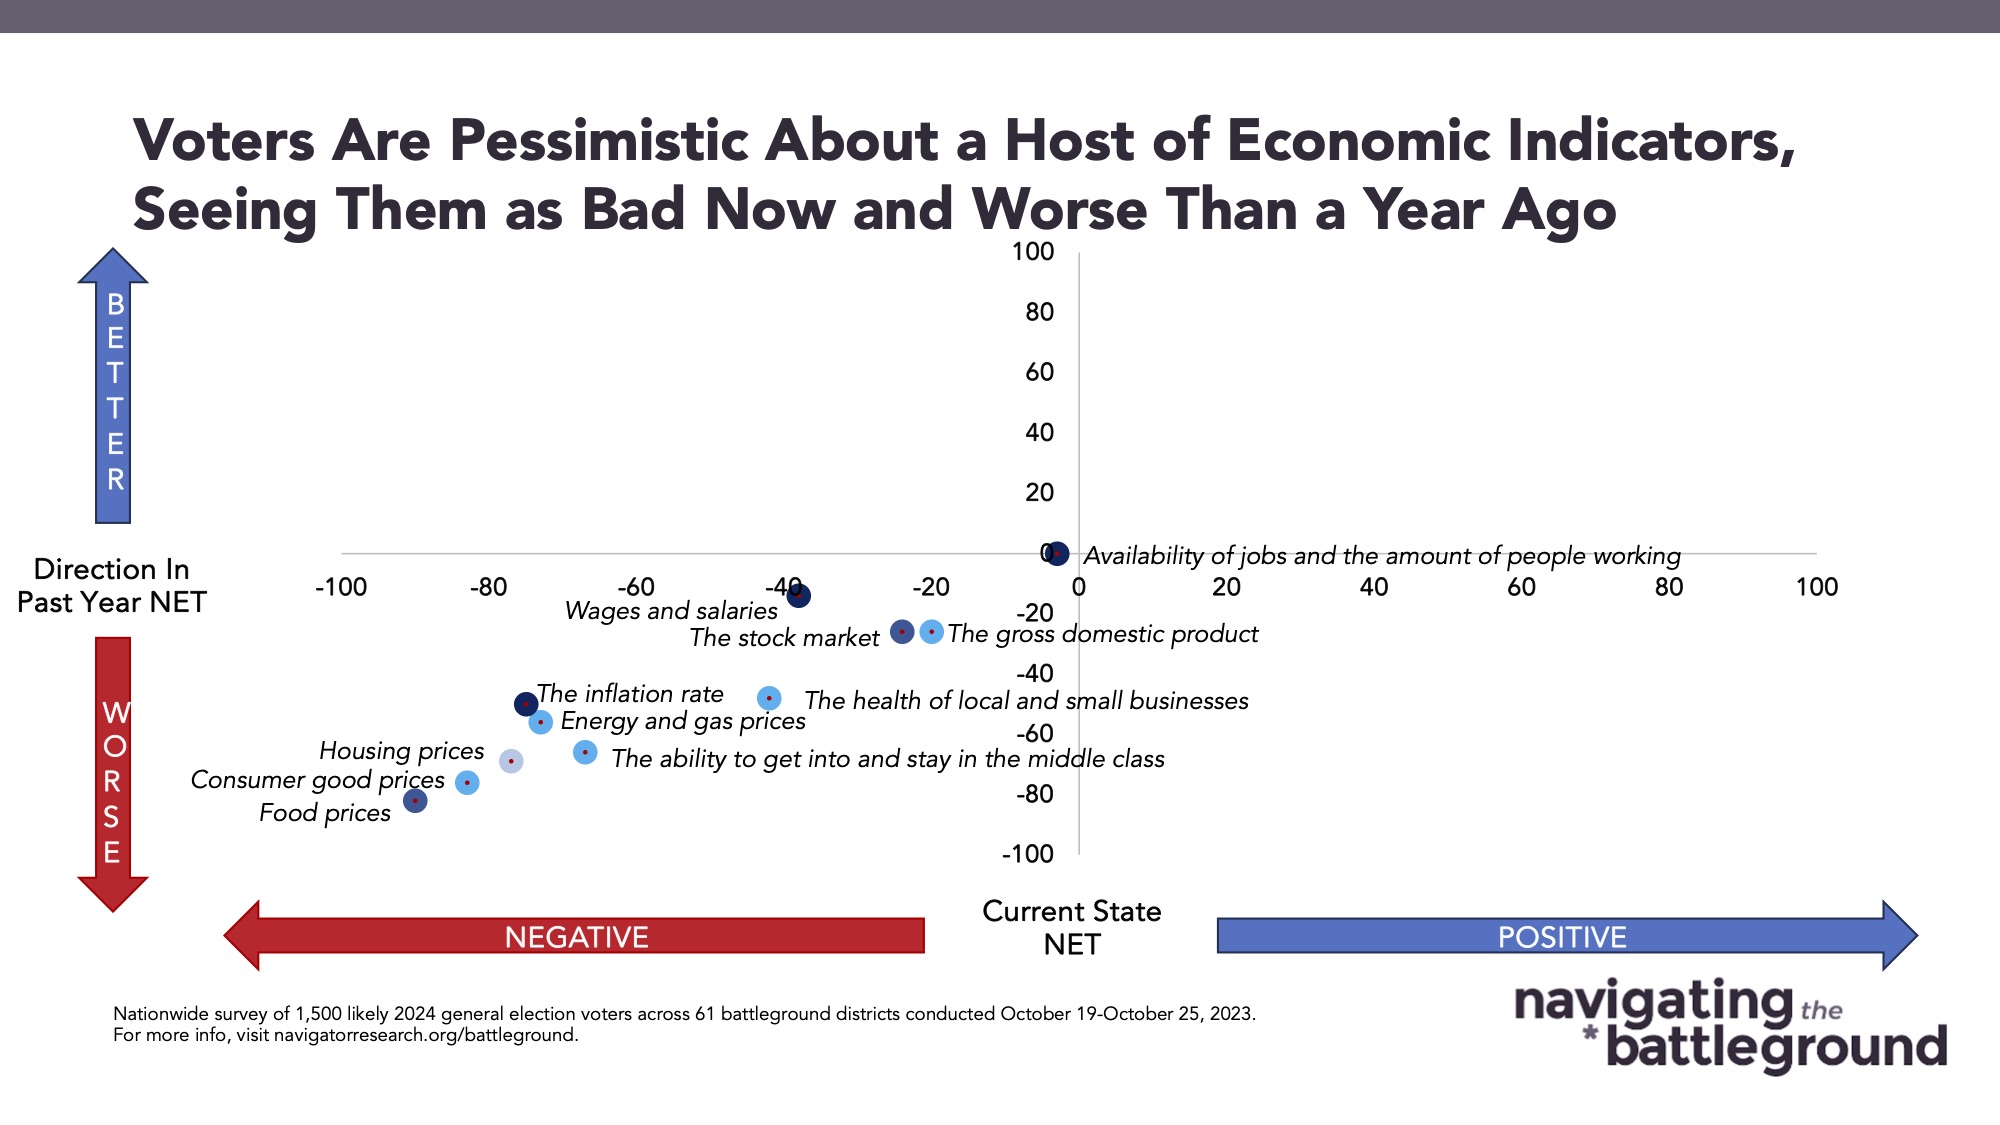
When asked to identify the weak points in the economy, battleground constituents were explicit in calling out rising costs, particularly the costs of food, consumer goods, and housing. 95 percent of Americans in the battleground believe that food prices are doing “not so good” or “poor,” with 86 percent saying they’ve gotten worse over the last year. 91 percent say the same of consumer good prices, with 81 percent saying they’ve gotten worse of the last year. 87 percent say housing prices are “not so good” or “poor,” with 74 percent saying they’ve gotten worse over the last year. When it comes to employment, battleground constituents are more optimistic, but evenly split: 47 percent saying “availability of jobs and the amount of people working” is “excellent” or “good,” compared to 50 percent who say this is going “not so good” or “poor.”
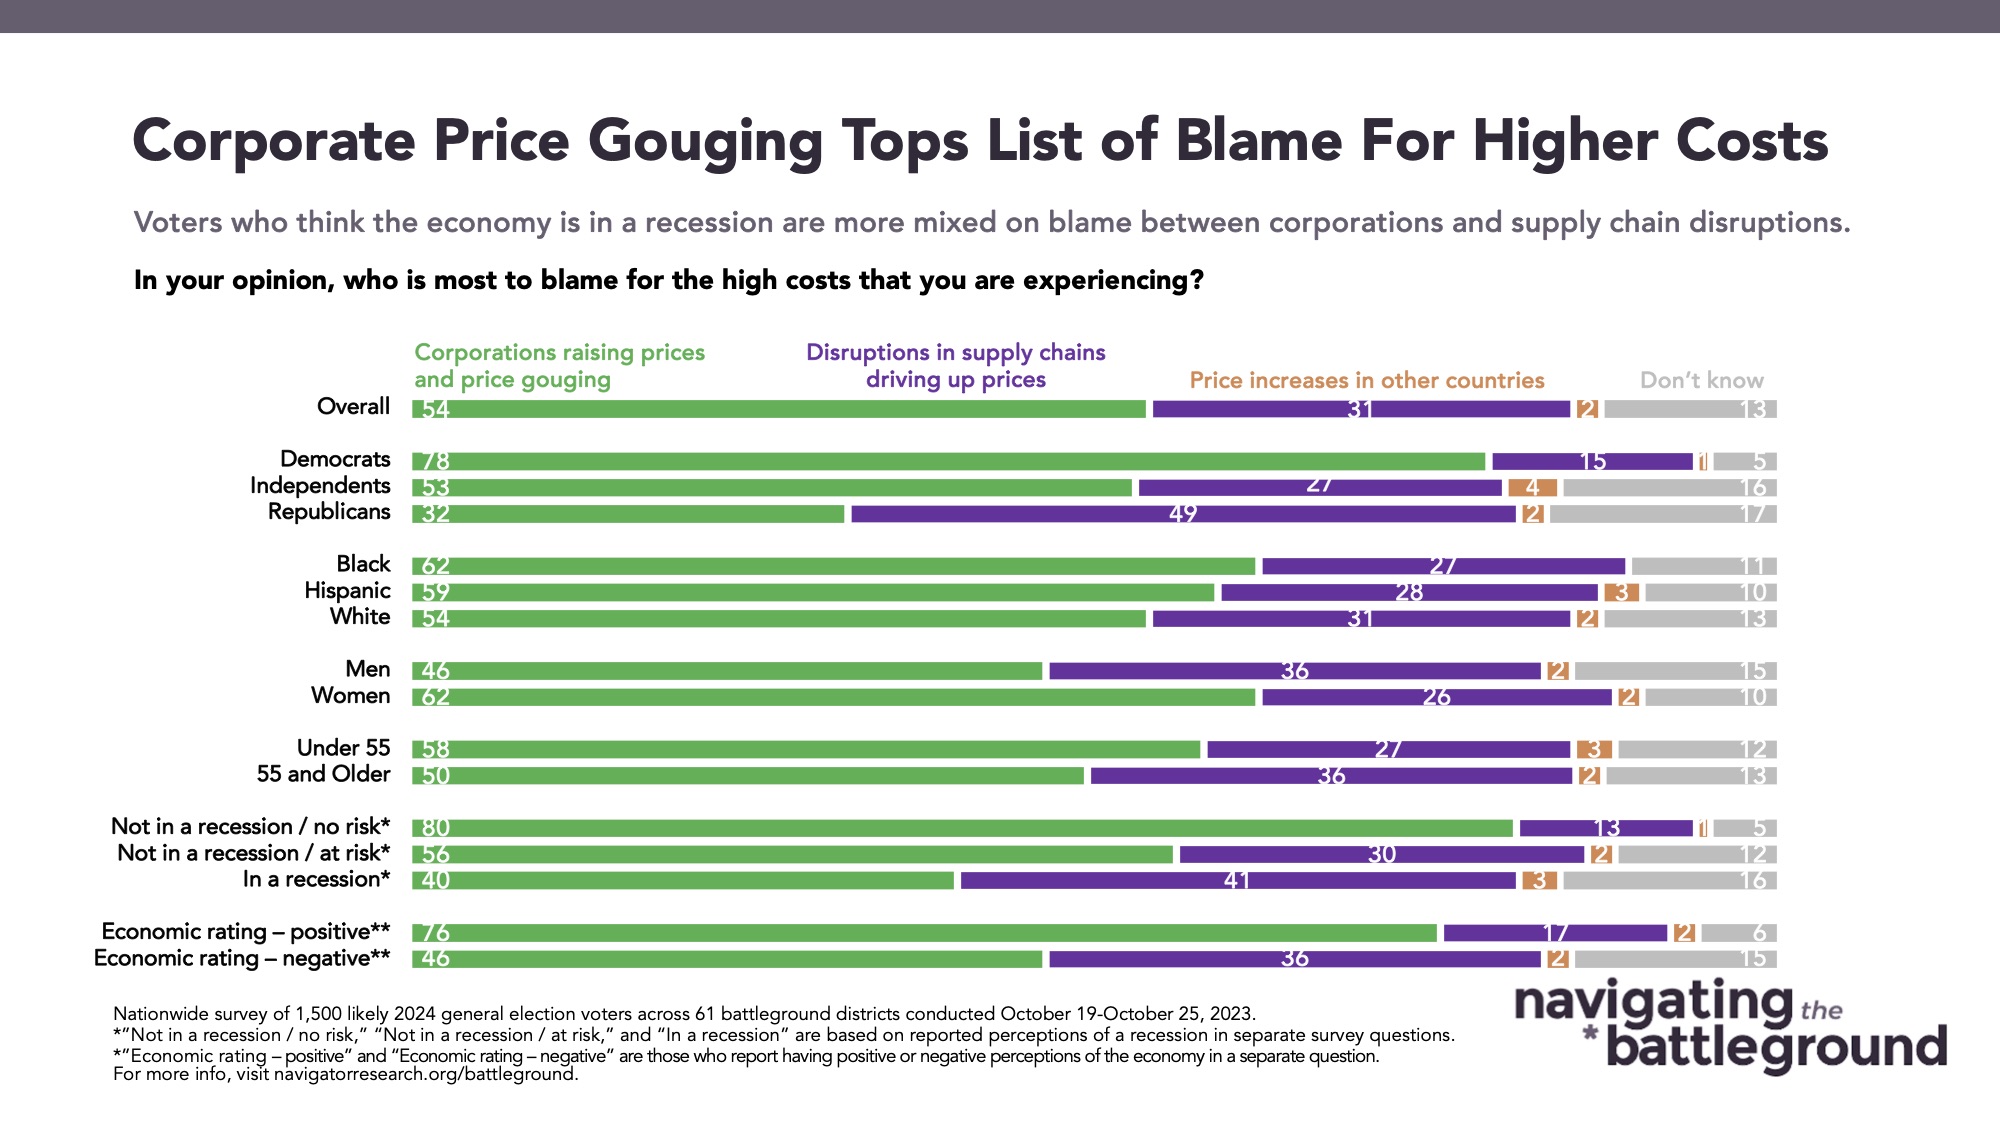
- When asking Americans whether they blamed “corporations raising prices and price gouging,” “disruptions in supply chains,” or “price increases in other countries” more for rising prices, a majority blamed corporations for price gouging and raising prices by 23 points more than supply chain disruptions (54 percent to 31 percent), with only 2 percent saying price increases in other countries and an additional 13 percent who are unsure.
A broad majority think the economy will either get worse or stay the same over the next year.
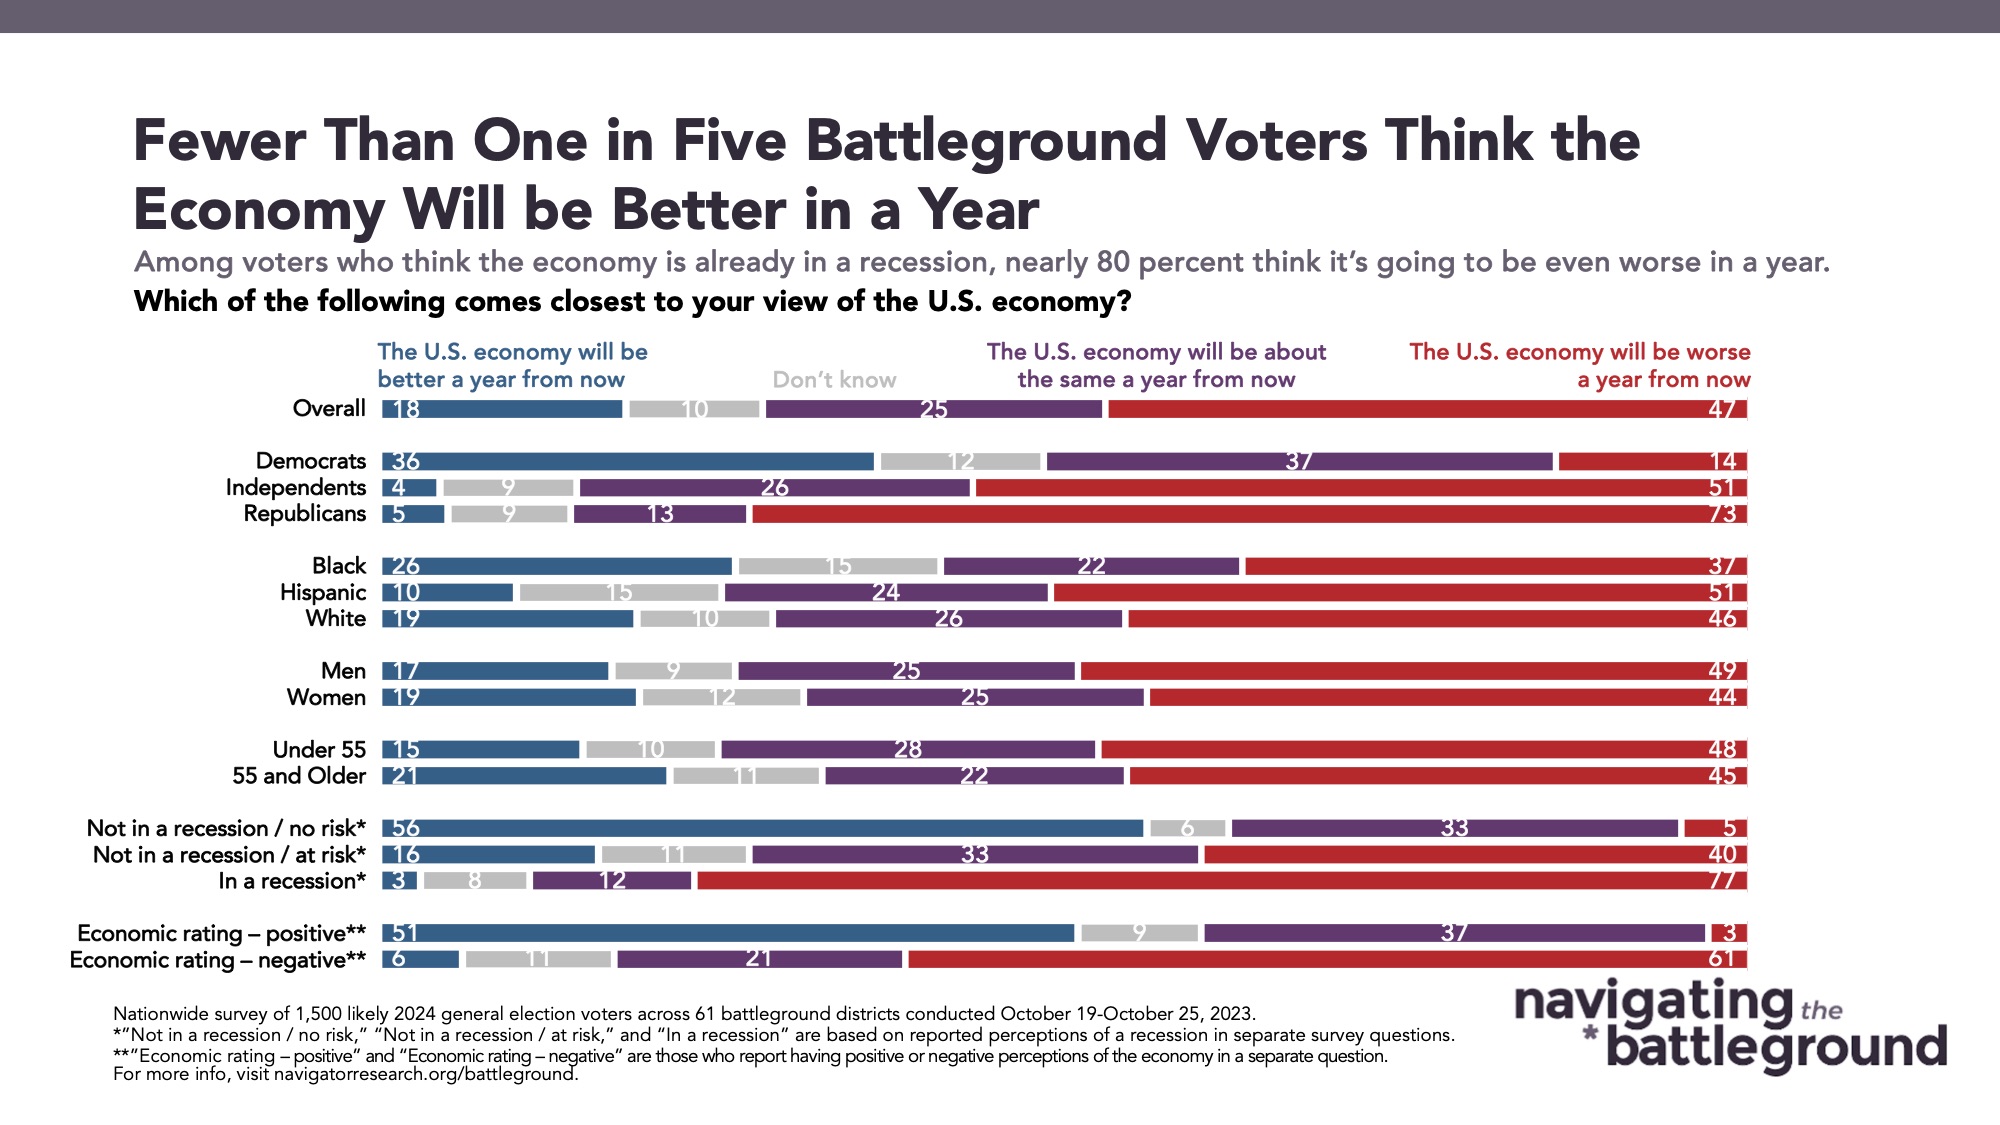
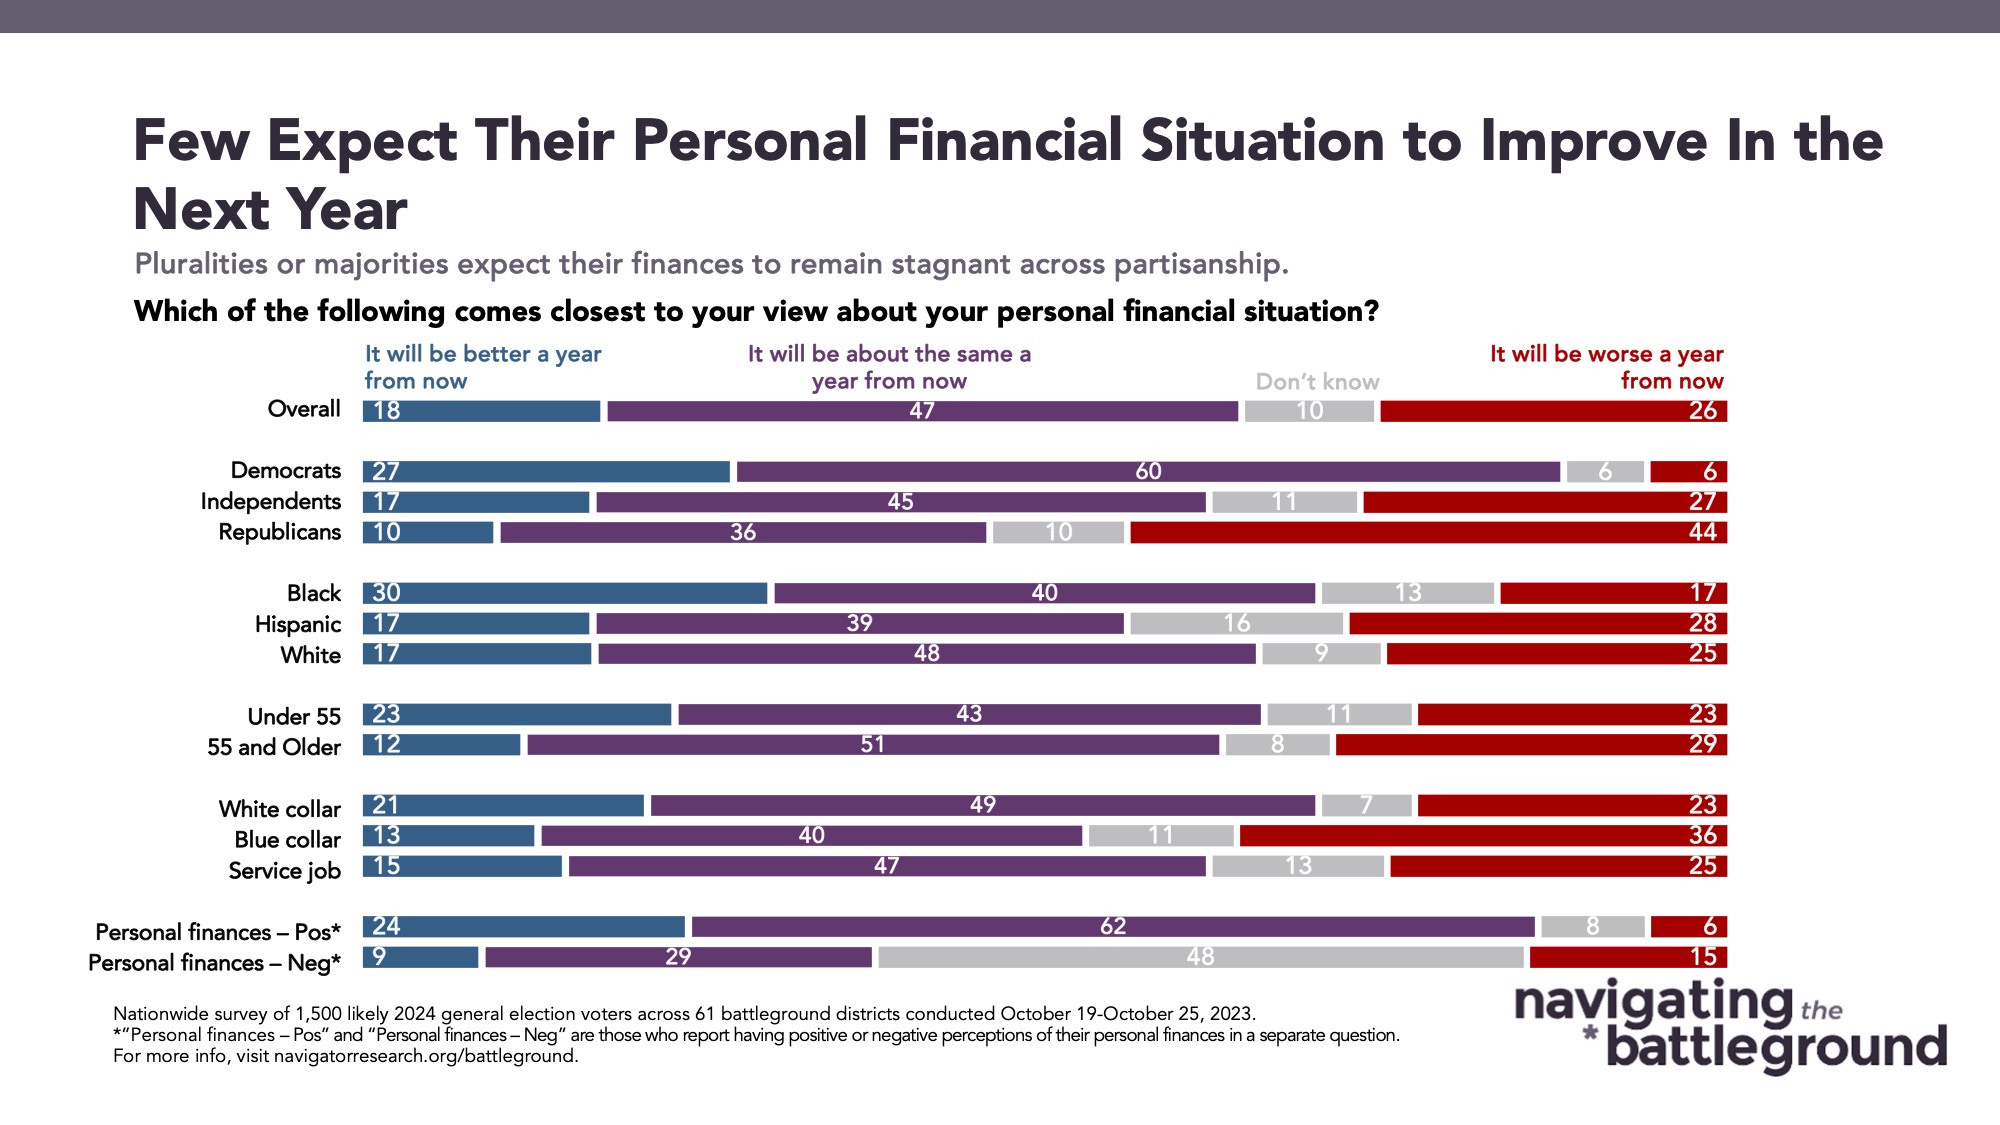
The future outlook on future improvements of both the national economy and constituents’ personal finances mirror the broader economic sentiment in the battleground. 47 percent of battleground constituents believe their personal financial situation will be the same a year from now, while 26 percent believe it will be worse. For the national economy, the inverse is true: 25 percent believe the national economy will be the same a year from now and 47 percent believe it will be worse. Whether rating their individual financial situations or the overall economy, only 18 percent say either will be better a year from now.
