Poll: Democratic and Republican Lawmakers
This Navigator Research report contains polling data tracking perceptions of both Democratic lawmakers and Republican lawmakers in the battleground, including their favorability ratings, ratings of their overall job handling and their handling of the economy, and who constituents trust more to handle a variety of policy issues and priorities.
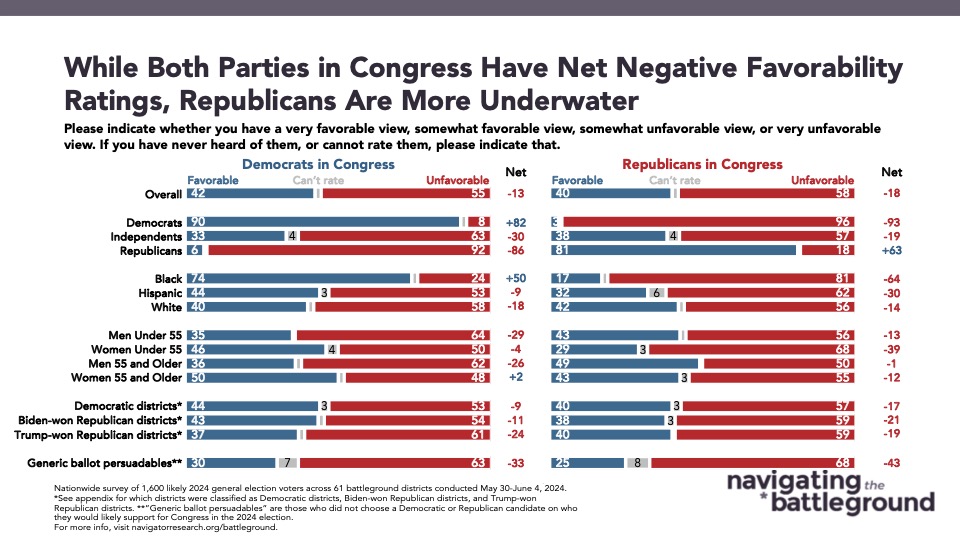
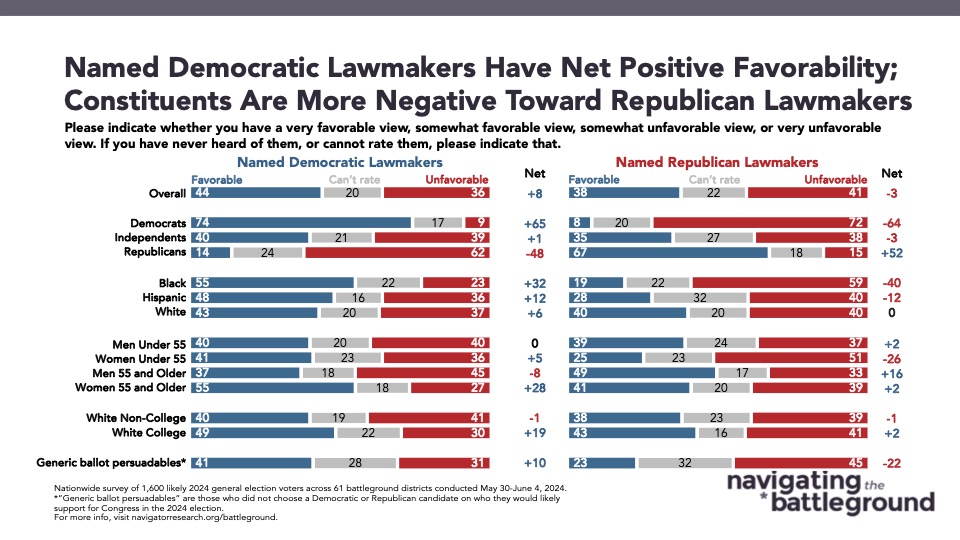
While both parties have net negative favorability ratings, named Democratic lawmakers have net positive ratings.
Named Democratic lawmakers have net positive favorability ratings while named Republican lawmakers are net negative, despite the fact that people dislike both parties generically. A plurality of constituents living in districts with Democratic lawmakers are favorable toward them (net +8; 44 percent favorable – 36 percent unfavorable) while those living in districts with Republican lawmakers are narrowly net unfavorable toward their members of Congress (net -3; 38 percent favorable – 41 percent unfavorable). Demographics that have the most pronounced differences include Black constituents by a net 72 points (net +32 for Democratic lawmakers compared to net -40 for Republican lawmakers), women over the age of 55 years old by a net 26 points (net +28 for Democratic lawmakers compared to net +2 for Republican lawmakers), and Hispanic constituents by a net 24 points (net +12 for Democratic lawmakers as compared to net -12 for Republican lawmakers).
- Generically, Democrats in Congress have a net -13 favorability rating (42 percent favorable – 55 percent unfavorable) while Republicans in Congress’ rating is slightly worse (net -18; 40 percent favorable – 58 percent unfavorable).
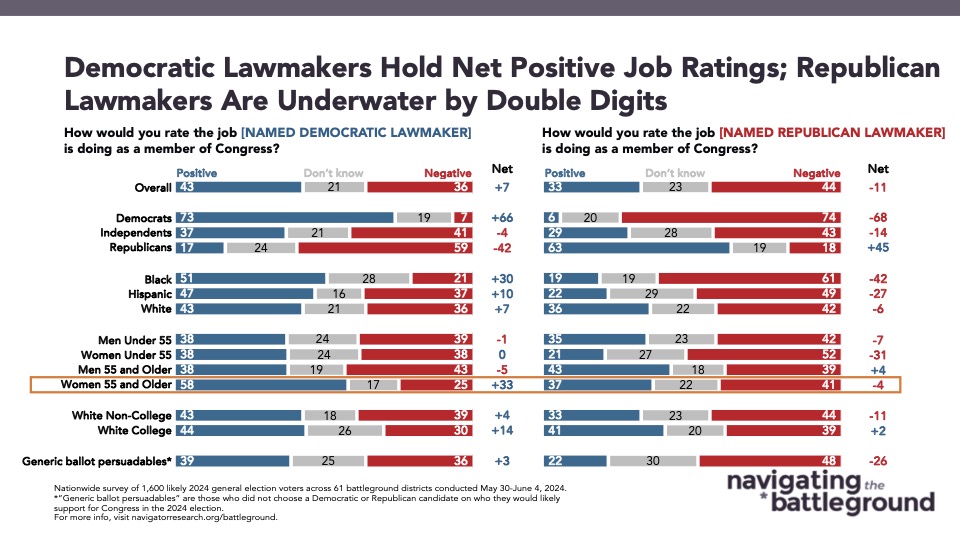
Democratic lawmakers also have comparative advantages to Republican lawmakers on overall job ratings.
The gap between named Democratic lawmakers and named Republican lawmakers is slightly larger on handling their jobs as members of Congress, with Democratic lawmakers viewed net positively and Republican lawmakers viewed net negatively. Democratic lawmakers are above water by a net 7 points (43 percent positive – 36 percent negative) while Republican lawmakers are underwater by a net 11 points (33 percent positive – 44 percent negative). Independents are narrowly net negative when rating the job performance of Democratic lawmakers (net -4; 37 percent positive – 41 percent negative), but are 10 points more net negative when rating Republican lawmakers (net -14; 29 percent positive – 43 percent negative).
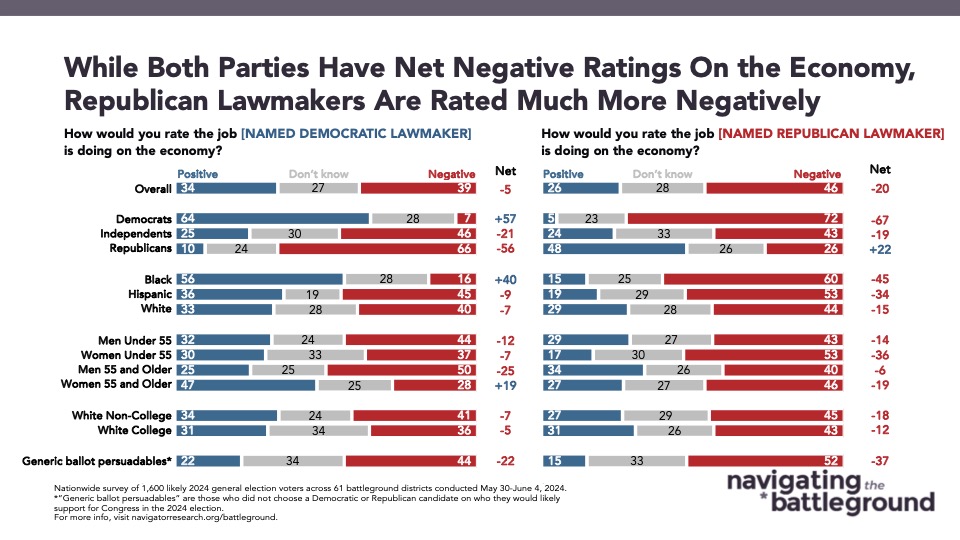
- When it comes to handling the economy, lawmakers of both parties earn net negative ratings, though Democratic lawmakers are net negative by 5 points (34 percent positive – 39 percent negative) while Republican lawmakers are net negative by 20 points (26 percent positive – 46 percent negative).
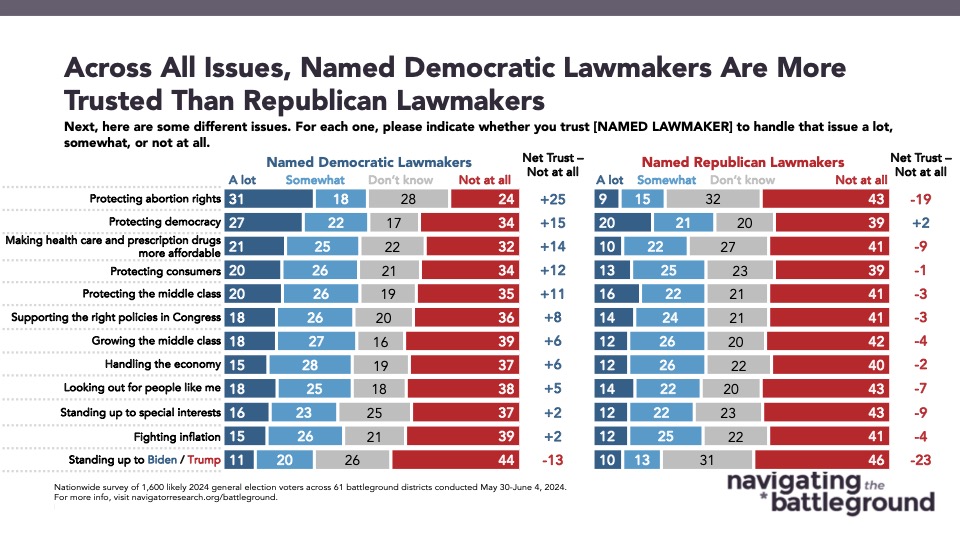
Named Democratic lawmakers earn higher trust ratings than named Republican lawmakers across a range of policy issues.
Democratic lawmakers earn net positive trust ratings from constituents by double digits on a number of issues, including protecting abortion rights (net +25; 49 percent trust – 24 percent trust not at all), protecting democracy (net +15; 49 percent trust – 34 percent trust not at all), making health care and prescription drugs more affordable (net +14; 46 percent trust – 32 percent trust not at all), protecting consumers (net +12; 46 percent trust – 34 percent trust not at all), and protecting the middle class (net +11; 46 percent trust – 35 percent trust not at all). By contrast, Republican lawmakers earn significantly lower trust ratings that are net negative in most cases.
- When it comes to protecting abortion rights, Republican lawmakers are distrusted more than trusted by 19 points (24 percent trust – 43 percent trust not at all); Democratic lawmakers have a 44-point net trust advantage compared to their Republican counterparts.
- Republican lawmakers are also underwater on making health care and prescription drugs more affordable (net -9; 32 percent trust – 41 percent trust not at all); Democratic lawmakers have a 23-point net trust advantage compared to Republican lawmakers on this issue.
- On fighting inflation, constituents are split on trust of named Democratic lawmakers (net +2; 41 percent trust – 39 percent trust not at all) while a plurality of constituents are distrustful of named Republican lawmakers (net -4; 37 percent trust – 41 percent trust not at all), a 6-point net trust advantage for Democratic lawmakers over Republicans.
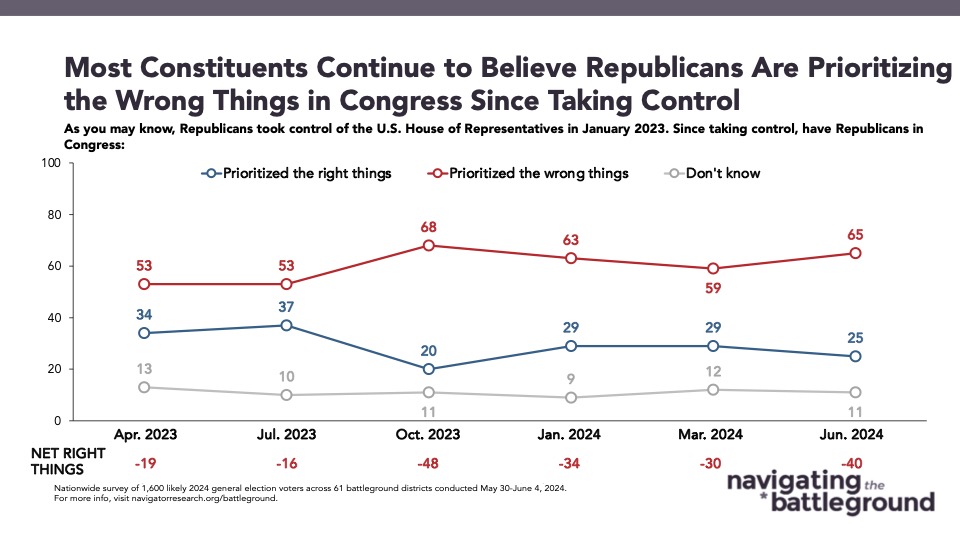
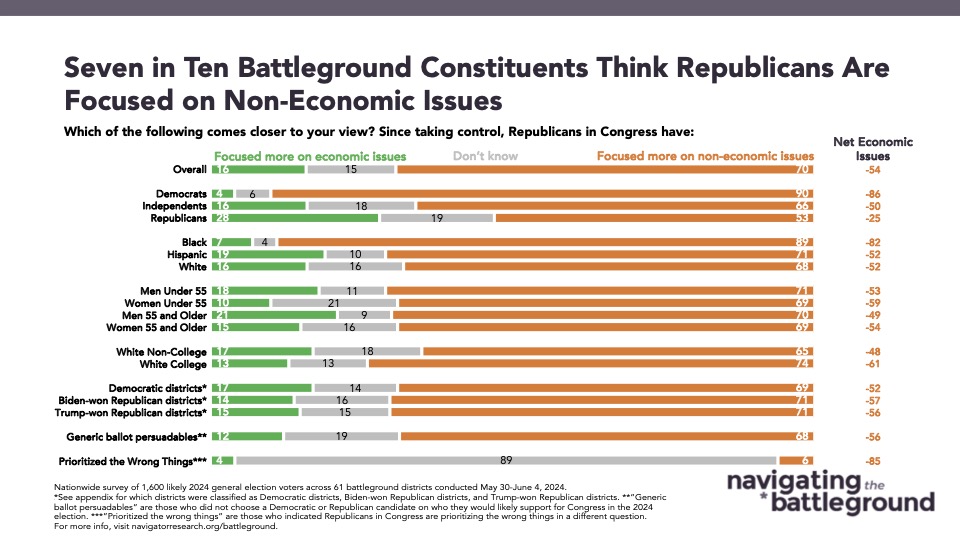
A large majority say Republicans are prioritizing the wrong things in Congress and are focused more on non-economic issues than on economic issues.
Two in three battleground constituents say Republicans in Congress are prioritizing the wrong things while just a quarter believe they are prioritizing the right things (net -40; 25 percent right things – 65 percent wrong things), which is a net 10-point uptick since March. By 54 points, seven in ten constituents in the battleground also think Republicans in Congress are focused more on non-economic issues (70 percent) than are focused more on economic issues (16 percent). Nearly nine in ten Black constituents (89 percent), seven in ten Hispanic constituents (71 percent), and two in three independents (66 percent) believe Republicans in Congress are focused more on non-economic issues.
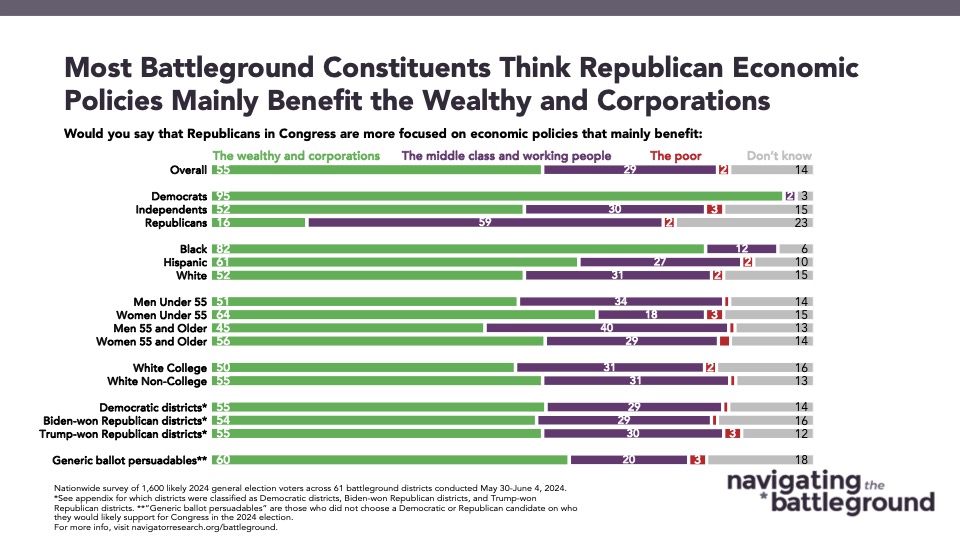
- Most battleground constituents, including a majority of independents, also believe Republicans in Congress are more focused on economic policies that mainly benefits the wealthy and corporations (55 percent overall; 52 percent of independents) compared to just three in ten who believe their economic policies mainly benefit the middle class and working people (29 percent overall; 30 percent of independents).

