Happy Holidays!
This special Navigator Research report contains polling data on how favorable Americans are toward candy canes and how this compares to perceptions of candy corn from when we asked in advance of Halloween, as well as which holiday movies Americans consider their favorite.
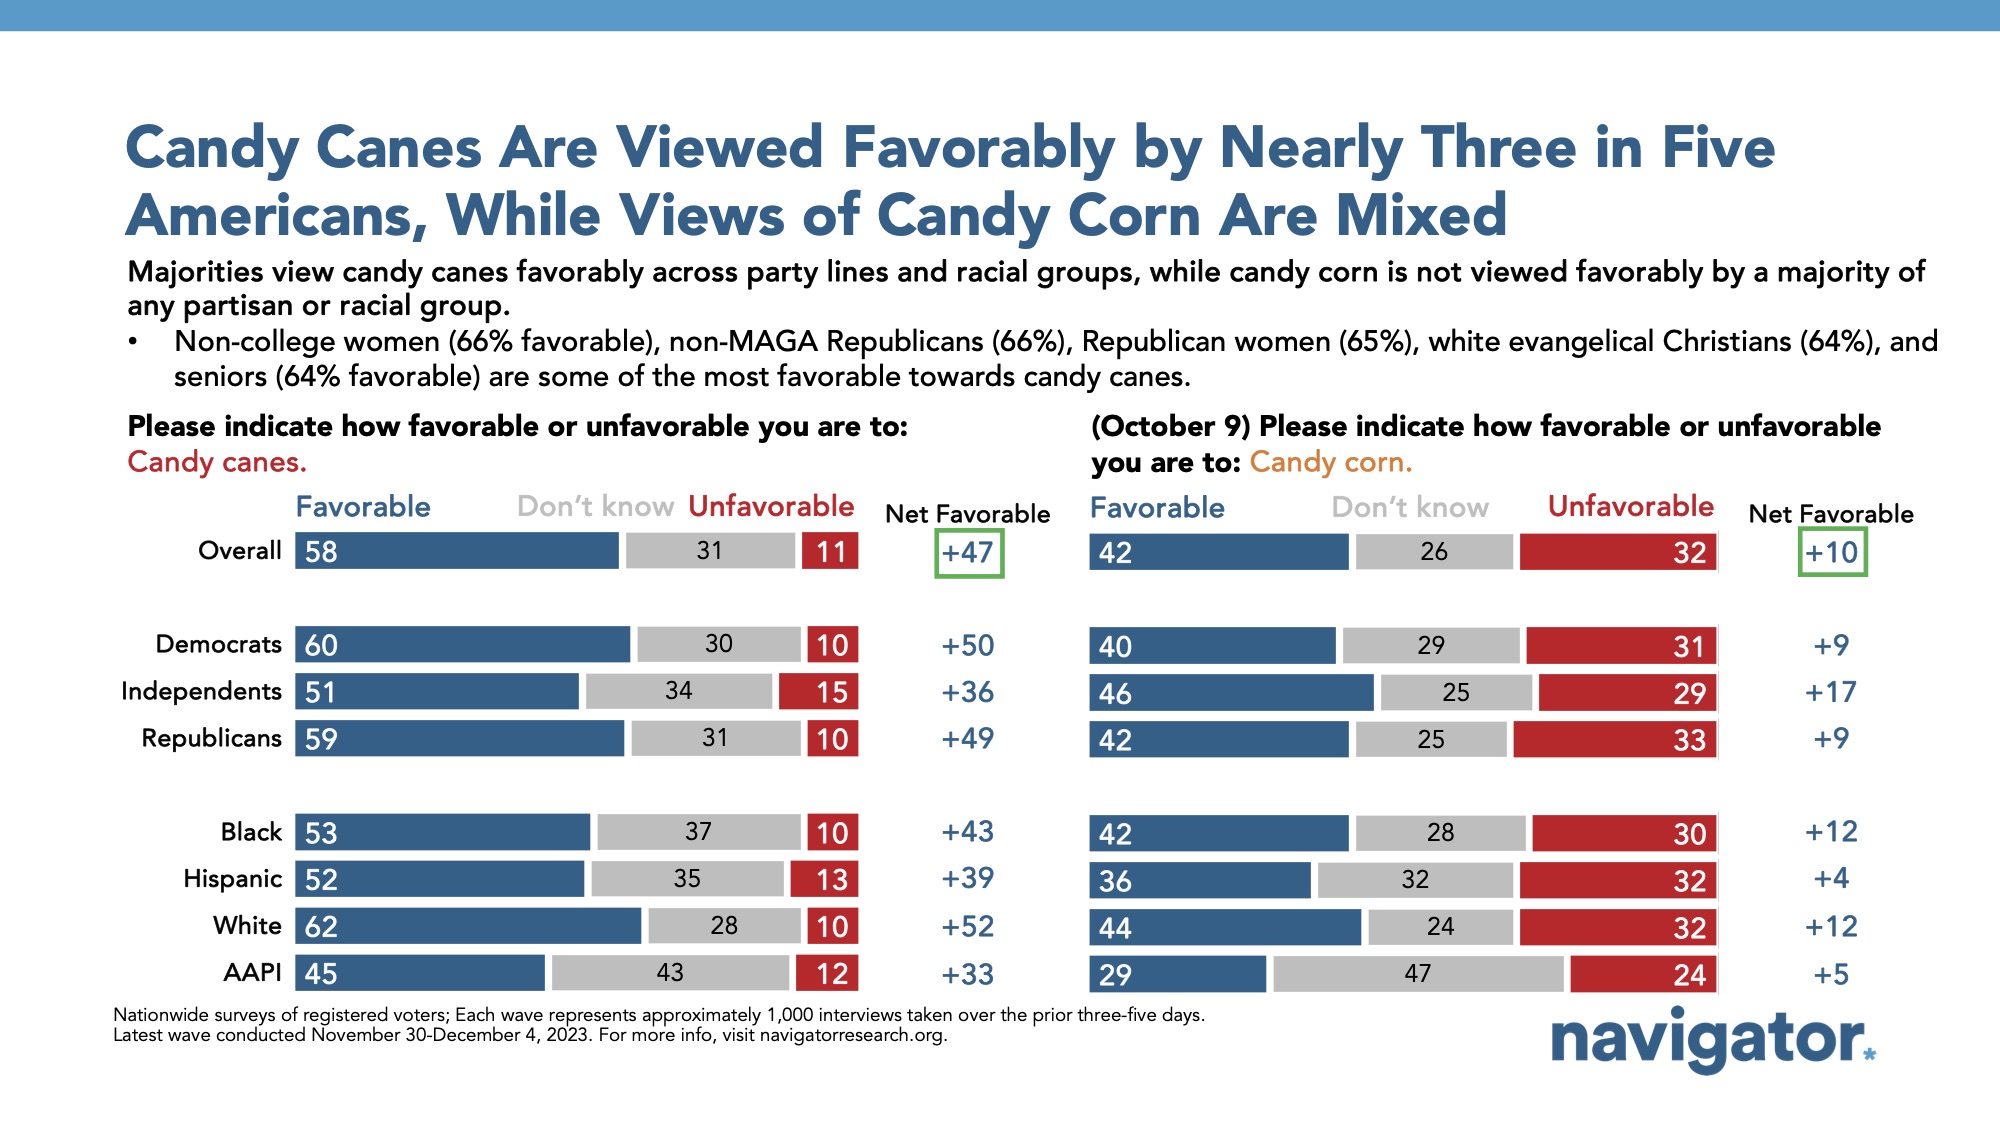
Nearly three in five Americans are favorable toward candy canes.
While Americans were divided on favorability of candy corn this past October (net +10; 42 percent favorable – 32 percent unfavorable), candy canes earn much stronger ratings during this holiday season with a net +47 favorability(net +47; 58 percent favorable – 11 percent unfavorable). Majorities are favorable toward candy canes across party lines, including 60 percent of Democrats, 59 percent of Republicans, and 51 percent of independents.
- Among the most favorable towards candy canes are non-college educated women (66 percent), non-MAGA Republicans (66 percent), Republican women (65 percent), white evangelical Christians (64 percent), and Americans over the age of 65 (64 percent).
- One in four college-educated Americans have not heard of candy canes (25 percent), compared to one in five non-college educated Americans (20 percent). Similarly, 27 percent of dads have never heard of candy canes and 20 percent have never heard of candy corn – a stark contrast to only 17 percent of moms who have never heard of candy canes and 11 percent who have never heard of candy corn.
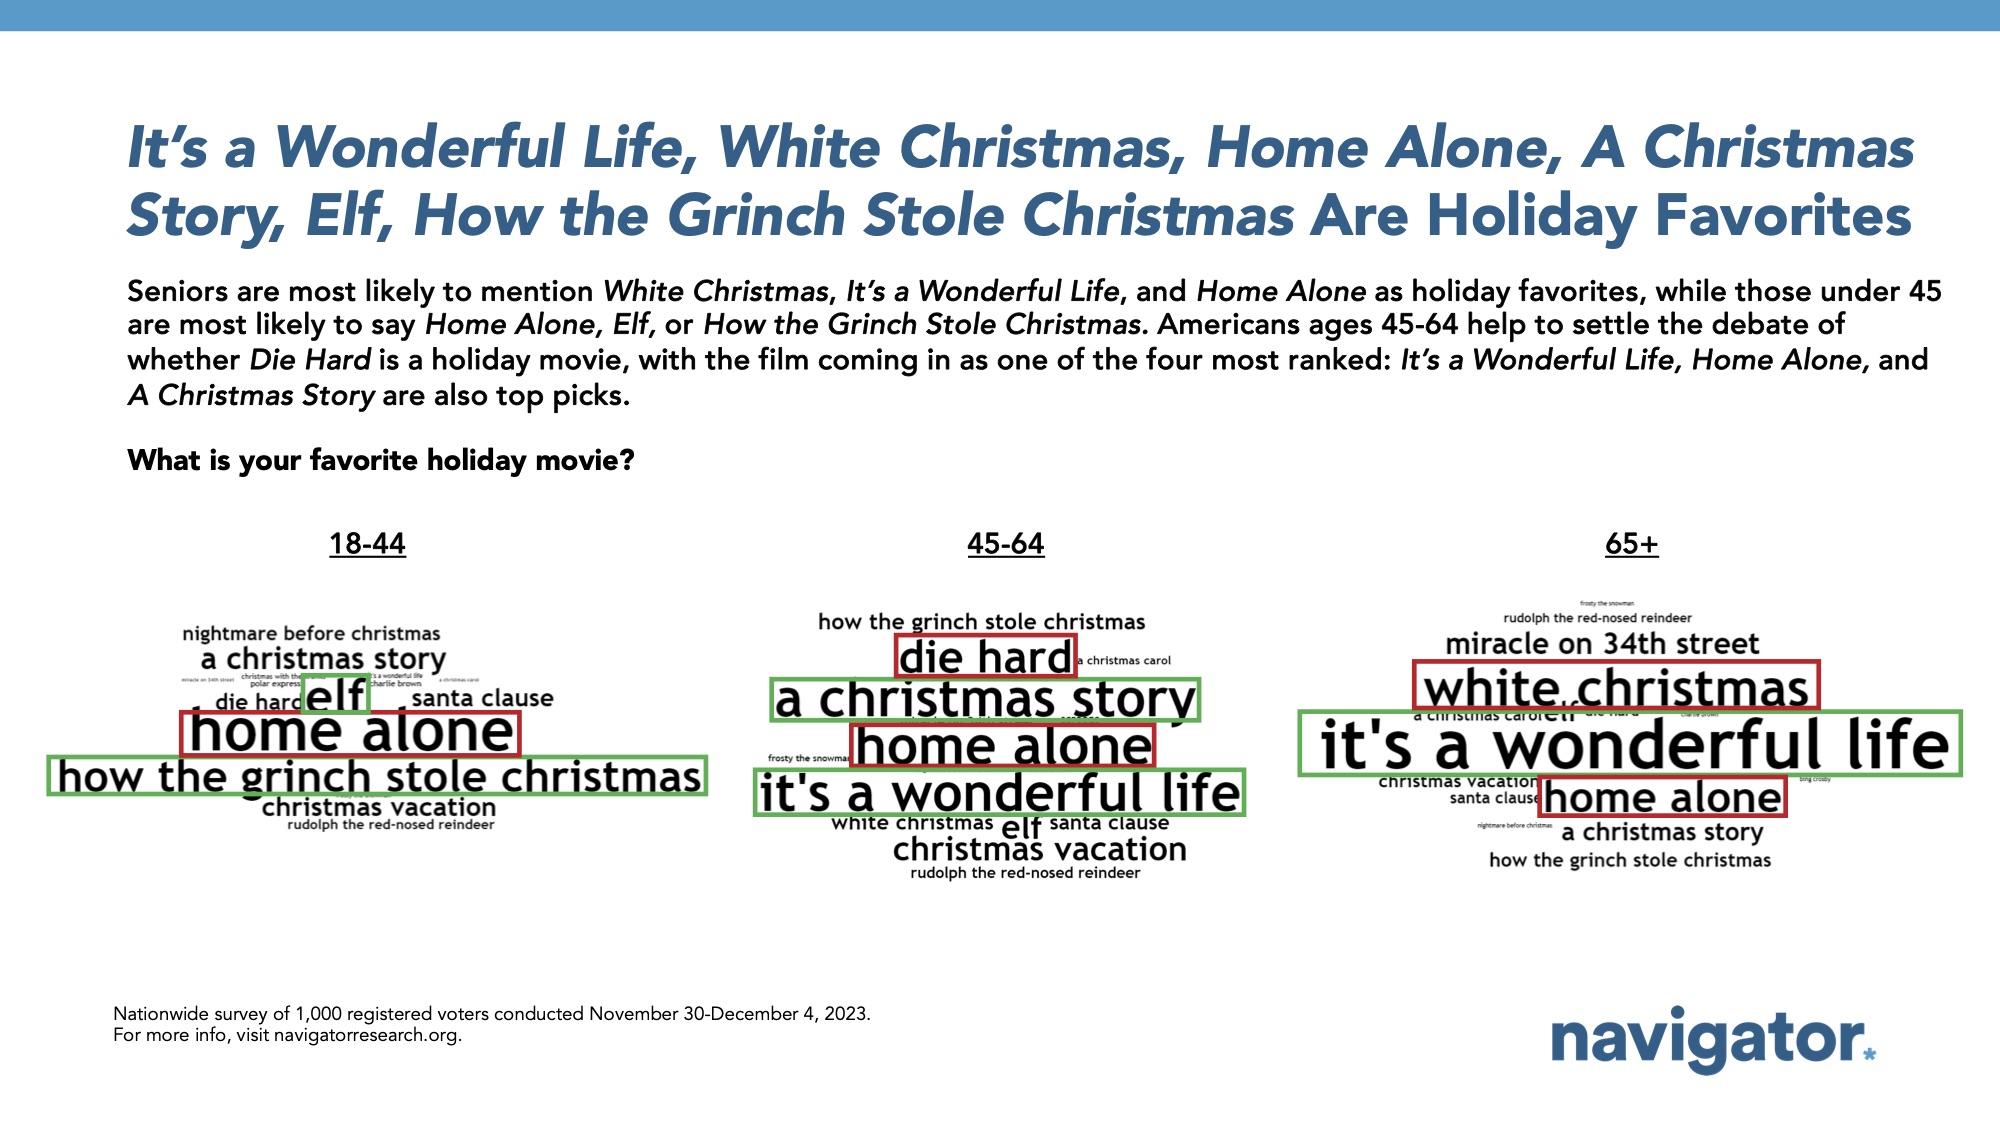
Americans say their favorite holiday movies are It’s a Wonderful Life, White Christmas, Home Alone, A Christmas Story, Elf, and How the Grinch Stole Christmas.
The top holiday movie favorites for those over the age of 65 include White Christmas, It’s a Wonderful Life, and Home Alone. Americans aged 45 to 64 also list It’s a Wonderful Life as a holiday favorite along with A Christmas Story, Home Alone, and Die Hard. Americans under the age of 45 are most likely to say Home Alone, Elf, and How the Grinch Stole Christmas is their favorite holiday movie.
About The Study
Global Strategy Group conducted public opinion surveys among a sample of 1,000 registered voters from November 30-December 4, 2023. 100 additional interviews were conducted among Hispanic voters. 75 additional interviews were conducted among Asian American and Pacific Islander voters. 100 additional interviews were conducted among African American voters. 100 additional interviews were conducted among independent voters. The survey was conducted online, recruiting respondents from an opt-in online panel vendor. Respondents were verified against a voter file and special care was taken to ensure the demographic composition of our sample matched that of the national registered voter population across a variety of demographic variables.


