Poll: The Republican Budget
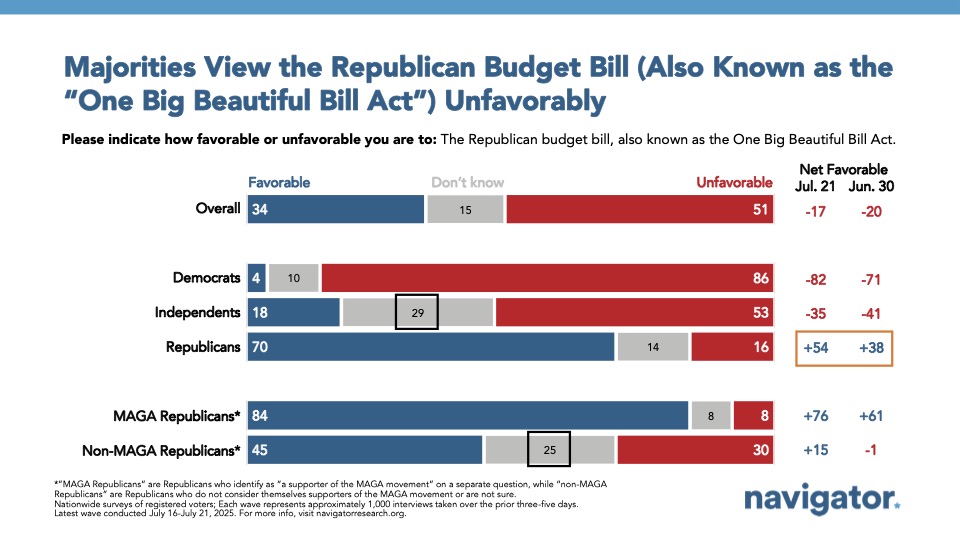
A majority of Americans view the Republican budget bill unfavorably, including 42 percent who view it very unfavorably. Unfavorability is driven by 86 percent of Democrats, as well as 53 percent of independents.
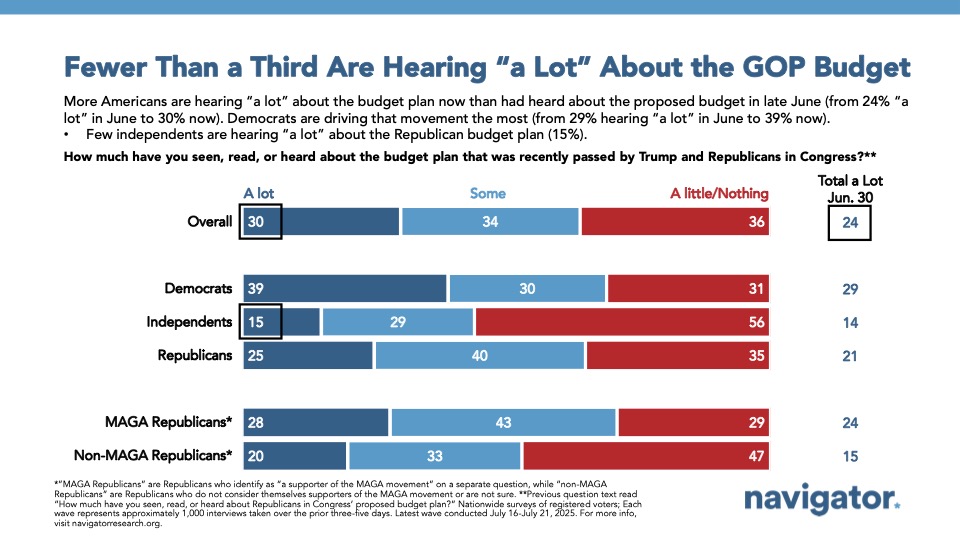
Overall, more Americans are familiar with the GOP budget act (86 percent, up from 76 percent) now than before it became law. More Americans also say they are hearing about President Trump and Republicans’ cuts to Medicaid in the budget (71 percent, including 39 percent who are hearing “a lot”) than had heard about it last month (64 percent). Seven in ten continue to be concerned about the cuts, including 65 percent of independents.
The Message War
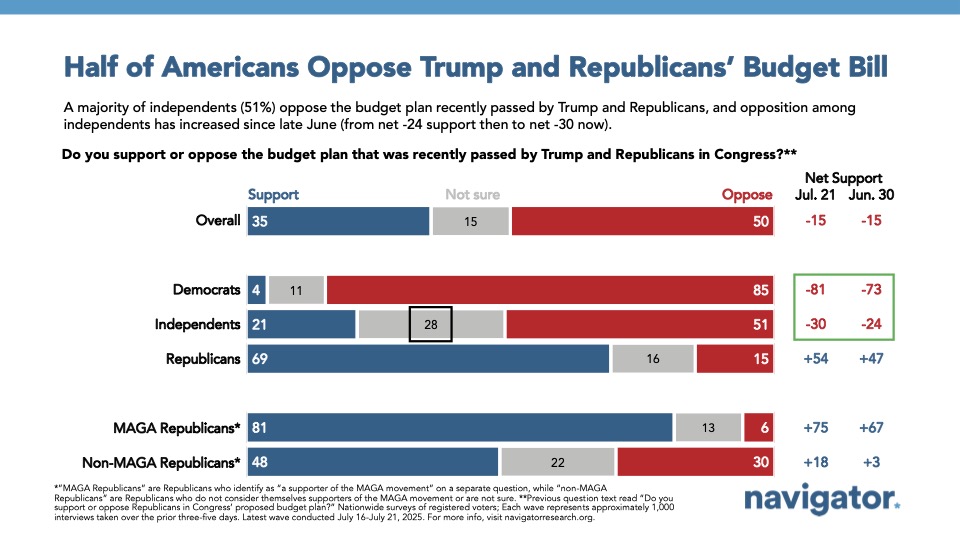
As Americans hear more about the recently passed tax and budget plan, their perceptions start to take shape. Only 35 percent of Americans support the budget, including just 15 percent who strongly support it. Half of Americans oppose the budget, including 38 percent who strongly oppose it. The primary drivers of support (or lack thereof) are partisan. However, 51 percent of independents also oppose the budget. Still, 28 percent of independents say they are not sure whether they support or oppose the budget.
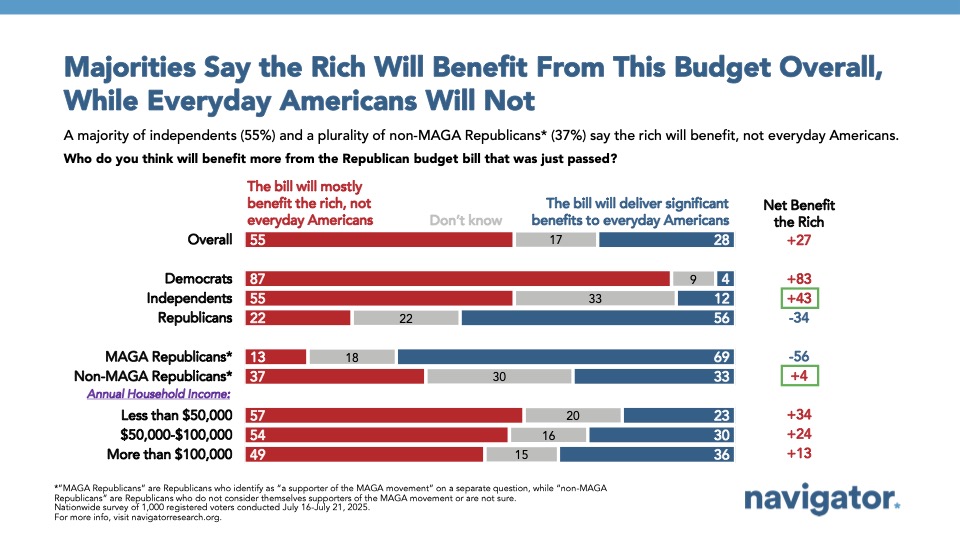
A majority of Americans and independents (55 percent) believe the bill will mostly benefit the rich, and not everyday Americans, as opposed to delivering significant benefits to everyday Americans (28 percent). Americans living in households making less than $100,000 per year (55 percent) are more likely than those making more than $100,000 per year (49 percent) to believe the bill will mostly benefit the rich.
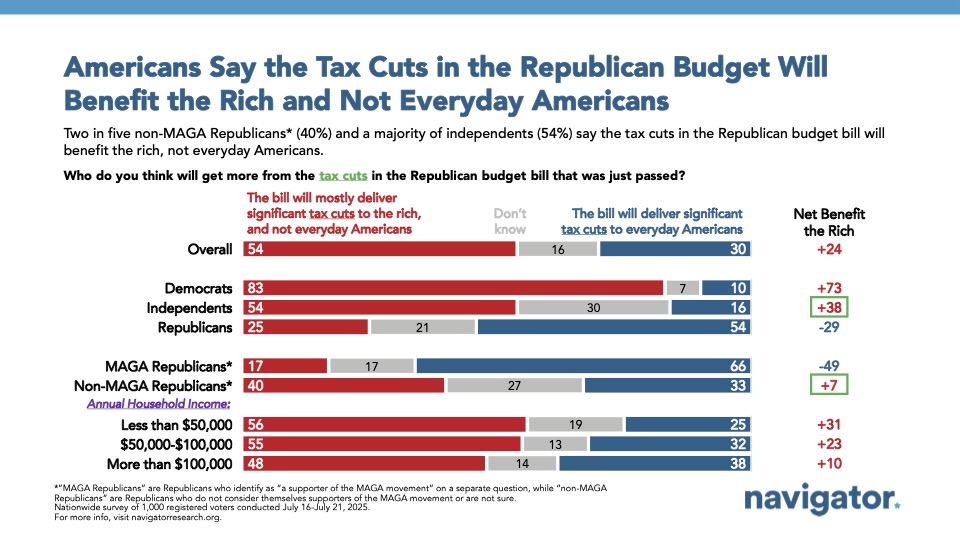
On taxes in particular, 54 percent believe the bill will mostly deliver significant tax cuts to the rich, and not tax cuts to everyday Americans (30 percent). Similarly, 55 percent of Americans living in a household making less than $100,000 per year believe the rich will mostly benefit from the tax cuts, compared to 48 percent of those living in households making more than $100,000 per year.
Medicaid
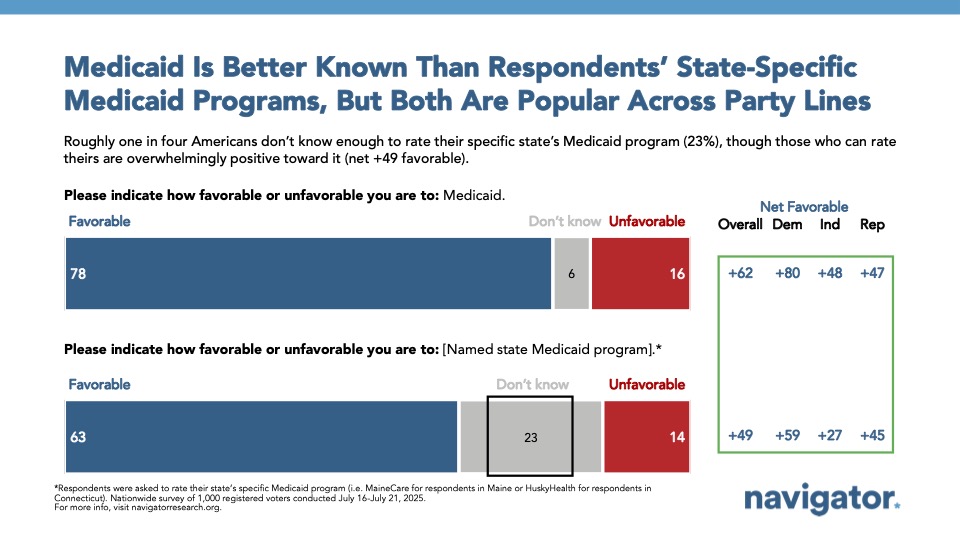
Americans remain overwhelmingly favorable toward Medicaid (78 percent favorable). This includes strong majorities across party lines: 88 percent of Democrats, 70 percent of Republicans, and 67 percent of independents have a favorable view.
On specific Medicaid state programs, majorities also view these programs favorably (63 percent), however, there is less familiarity with the state program names than the national brand of Medicaid (77 percent compared to 93 percent familiarity).
- 23 percent say they don’t know enough to rate the named state Medicaid program, compared to only 6 percent who say the same about Medicaid.
Advocates should link state Medicaid brands to the national Medicaid brand whenever possible. For example, “Our state’s Medicaid program, also known as [State program name].”
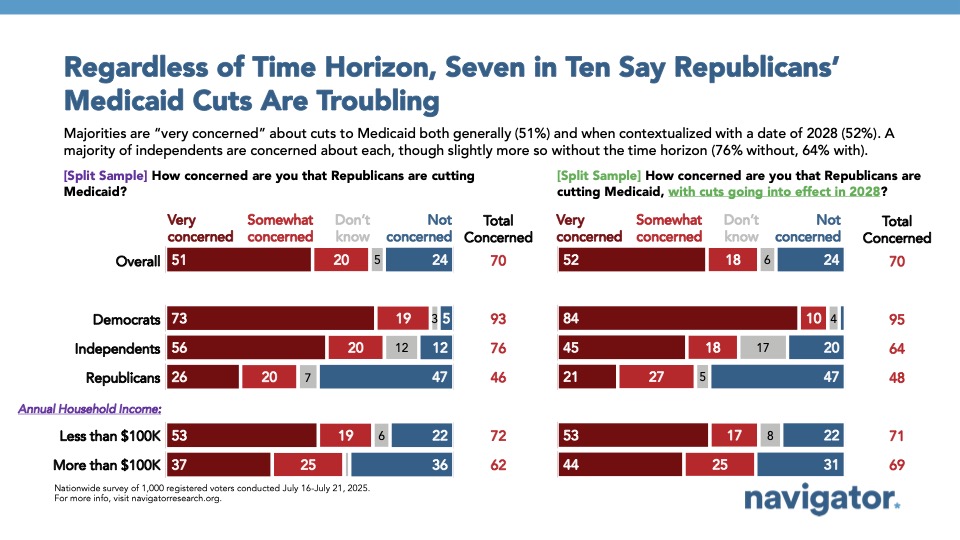
Seven in ten Americans are concerned that Republicans are cutting Medicaid, including a majority who are very concerned—regardless of when the cuts take effect. To understand if the delay in Medicaid cuts impacts concern, we asked half of the respondents the following :
- How concerned are you that Republicans are cutting Medicaid?
- How concerned are you that Republicans are cutting Medicaid, with cuts going into effect in 2028?
Both questions evoked nearly identical concern overall, with independents expressing more concern around cuts generally (76 percent), however still overwhelmingly concerned about future cuts (64 percent).
Most Concerning Impacts
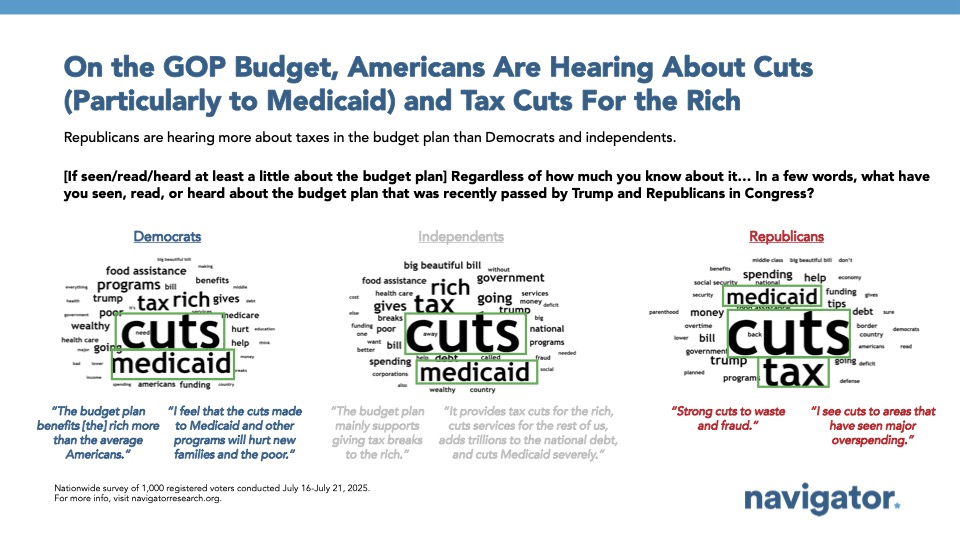
Those who have heard something about the budget plan are most likely to cite cuts—specifically referencing the cuts to Medicaid and food assistance.
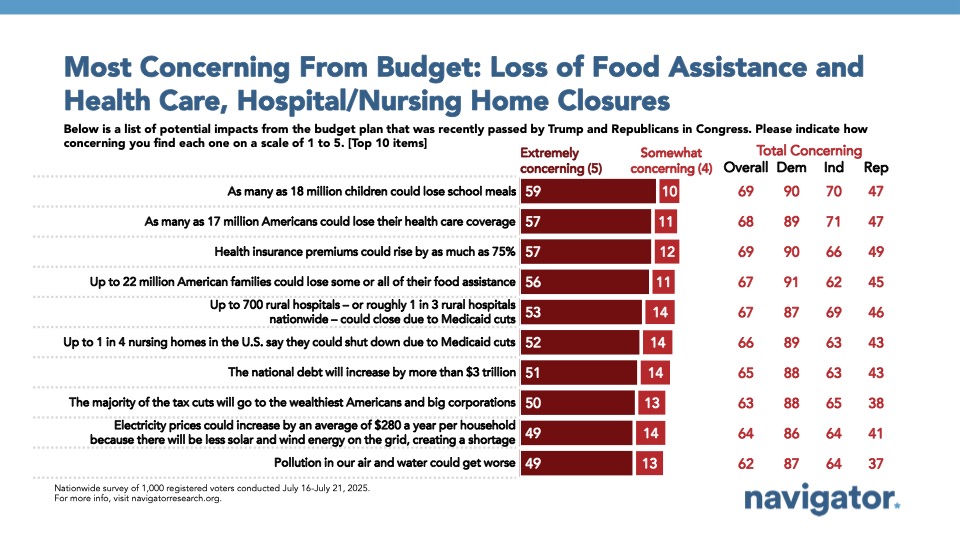
Americans are most concerned about kids losing school meals, health insurance premiums going up, and people losing their health care but are most unsure about the likelihood of these impacts:
- As many as 18 million children could lose school meals (69 percent find this concerning, 55 percent believe this is a likely impact);
- Health insurance premiums could rise by as much as 75% (69 percent find this concerning, 54 percent believe this is a likely impact);
- As many as 17 million Americans could lose their health care coverage (68 percent find this concerning, 61 percent believe this is a likely impact);
- Up to 22 million American families could lose some or all of their food assistance (67 percent find this concerning, 66 percent believe this is a likely impact);
- Up to 700 rural hospitals – or roughly 1 in 3 rural hospitals nationwide – could close due to Medicaid cuts (67 percent find this concerning, 60 percent believe this is a likely impact); and,
- Up to 1 in 4 nursing homes in the U.S. say they could shut down due to Medicaid cuts (66 percent find this concerning, 63 percent believe this is a likely impact).
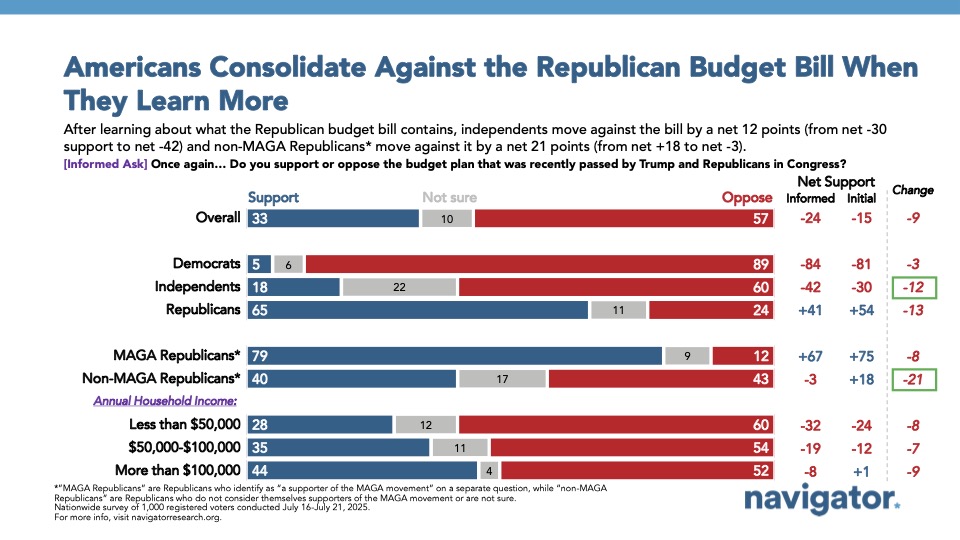
Learning more increases opposition to Trump and Republicans’ budget plan. Opposition grew from 50 percent to 57 percent when given more information about what’s included in the budget. Key demographics that moved to further oppose the budget include:
- Independents (from 51 percent to 60 percent)
- Republicans (from 15 percent to 24 percent)
- Specifically non-MAGA Republicans (from 30 percent to 43 percent)
- Passive news consumers (from 47 percent to 57 percent)
- Black Americans (from 69 percent to 78 percent)
- Hispanic Americans (from 53 percent to 61 percent)
About The Study
Global Strategy Group conducted a public opinion survey among a sample of 1,000 registered voters from July 16-July 21, 2025. 100 additional interviews were conducted among Hispanic voters. 100 additional interviews were conducted among African American voters. 100 additional interviews were conducted among younger voters between ages 18 and 27. 100 additional interviews were conducted among independent voters. The survey was conducted online, recruiting respondents from an opt-in online panel vendor. Respondents were verified against a voter file and special care was taken to ensure the demographic composition of our sample matched that of the national registered voter population across a variety of demographic variables. The margin of error for the full sample at the 95 percent level of confidence is +/- 3.1 percentage points. The margin of error for subgroups varies and is higher.
