Poll: Perceptions of Incumbents and Economic Outlook
This Navigating the Battleground report contains polling data on how constituents are assessing the job performance of their member of Congress within three types of battleground districts: Trump-won Republican districts, Biden-won Republican districts, and marginal Democratic districts. This release also looks at public perceptions of the economy and the effects of rising costs on the personal finances of Americans in these different types of battleground districts.
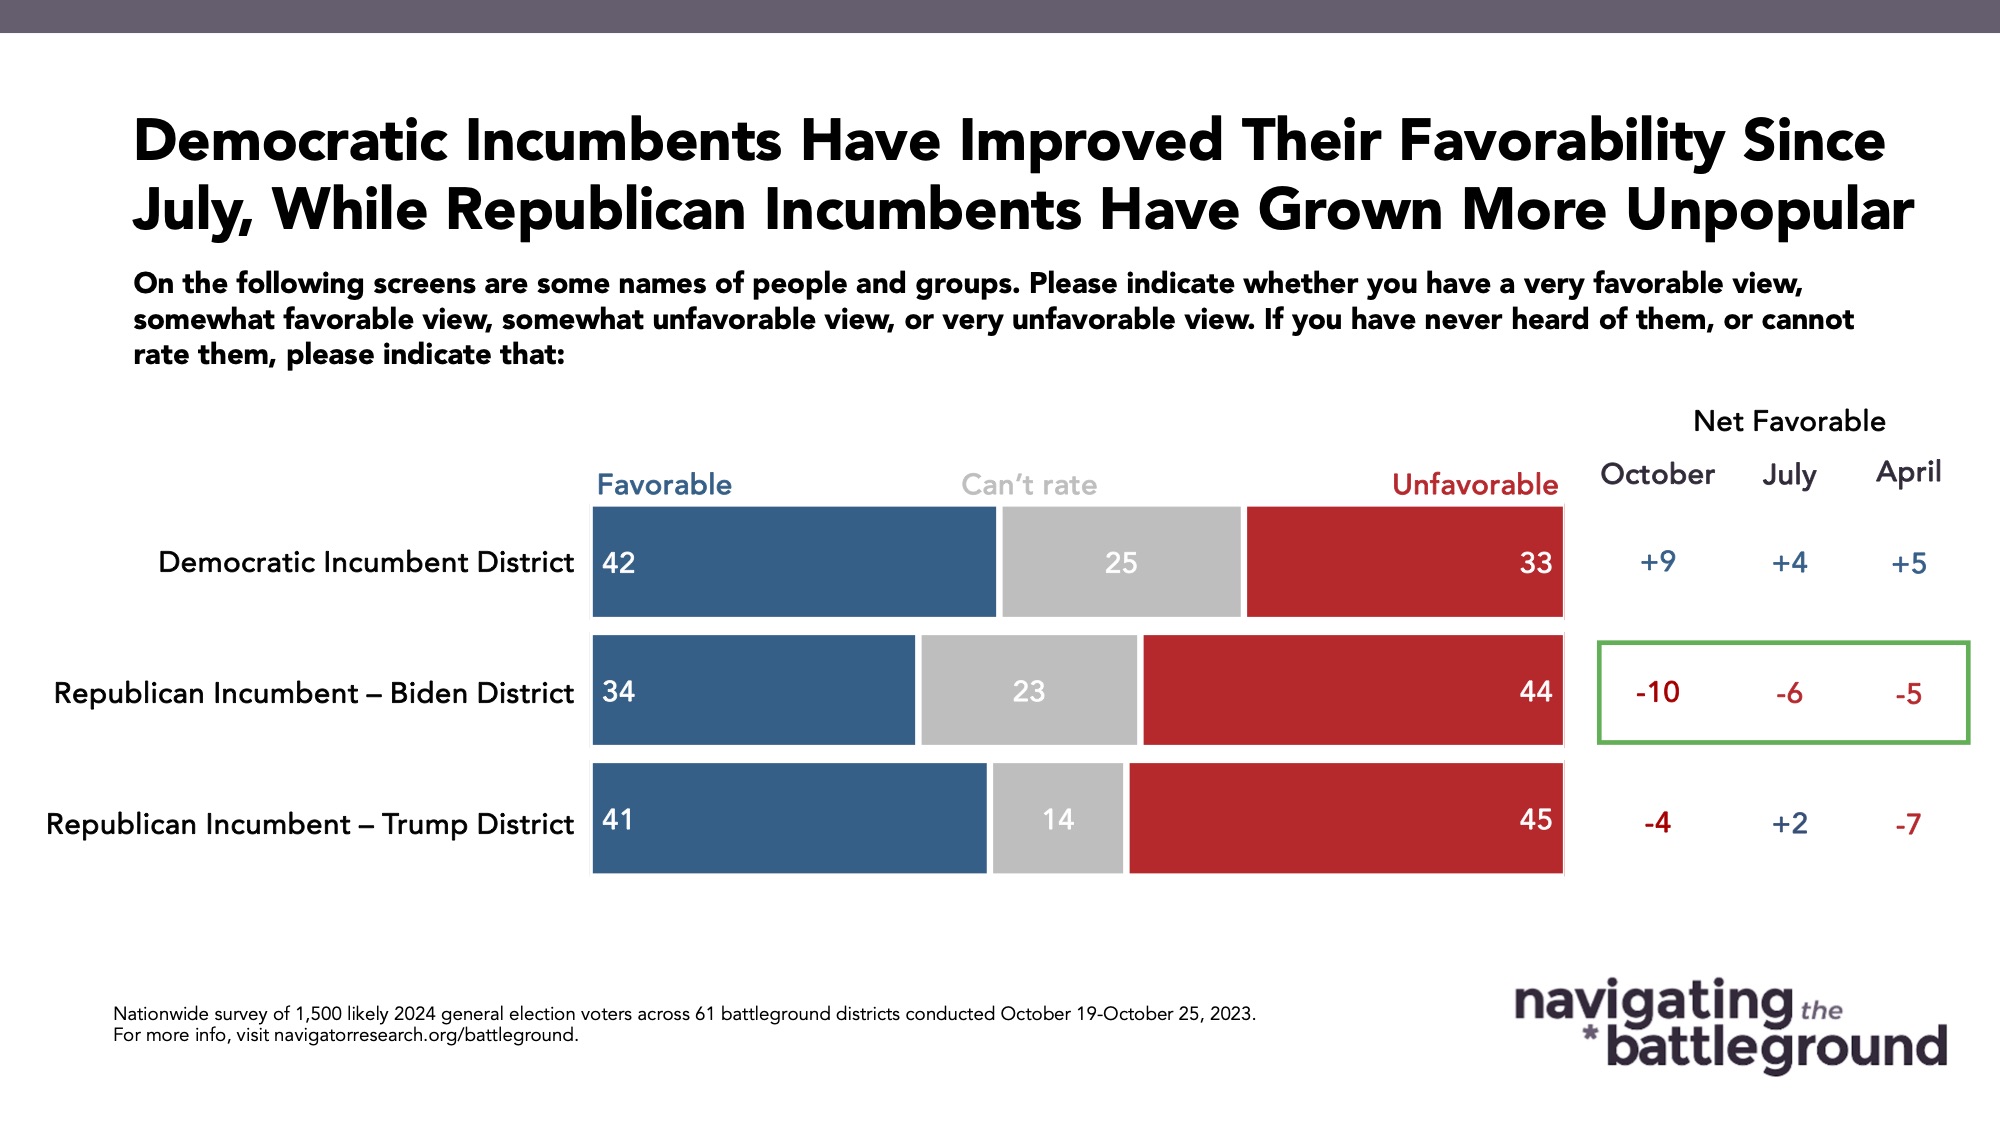
Republican incumbents have declined in favorability since July.
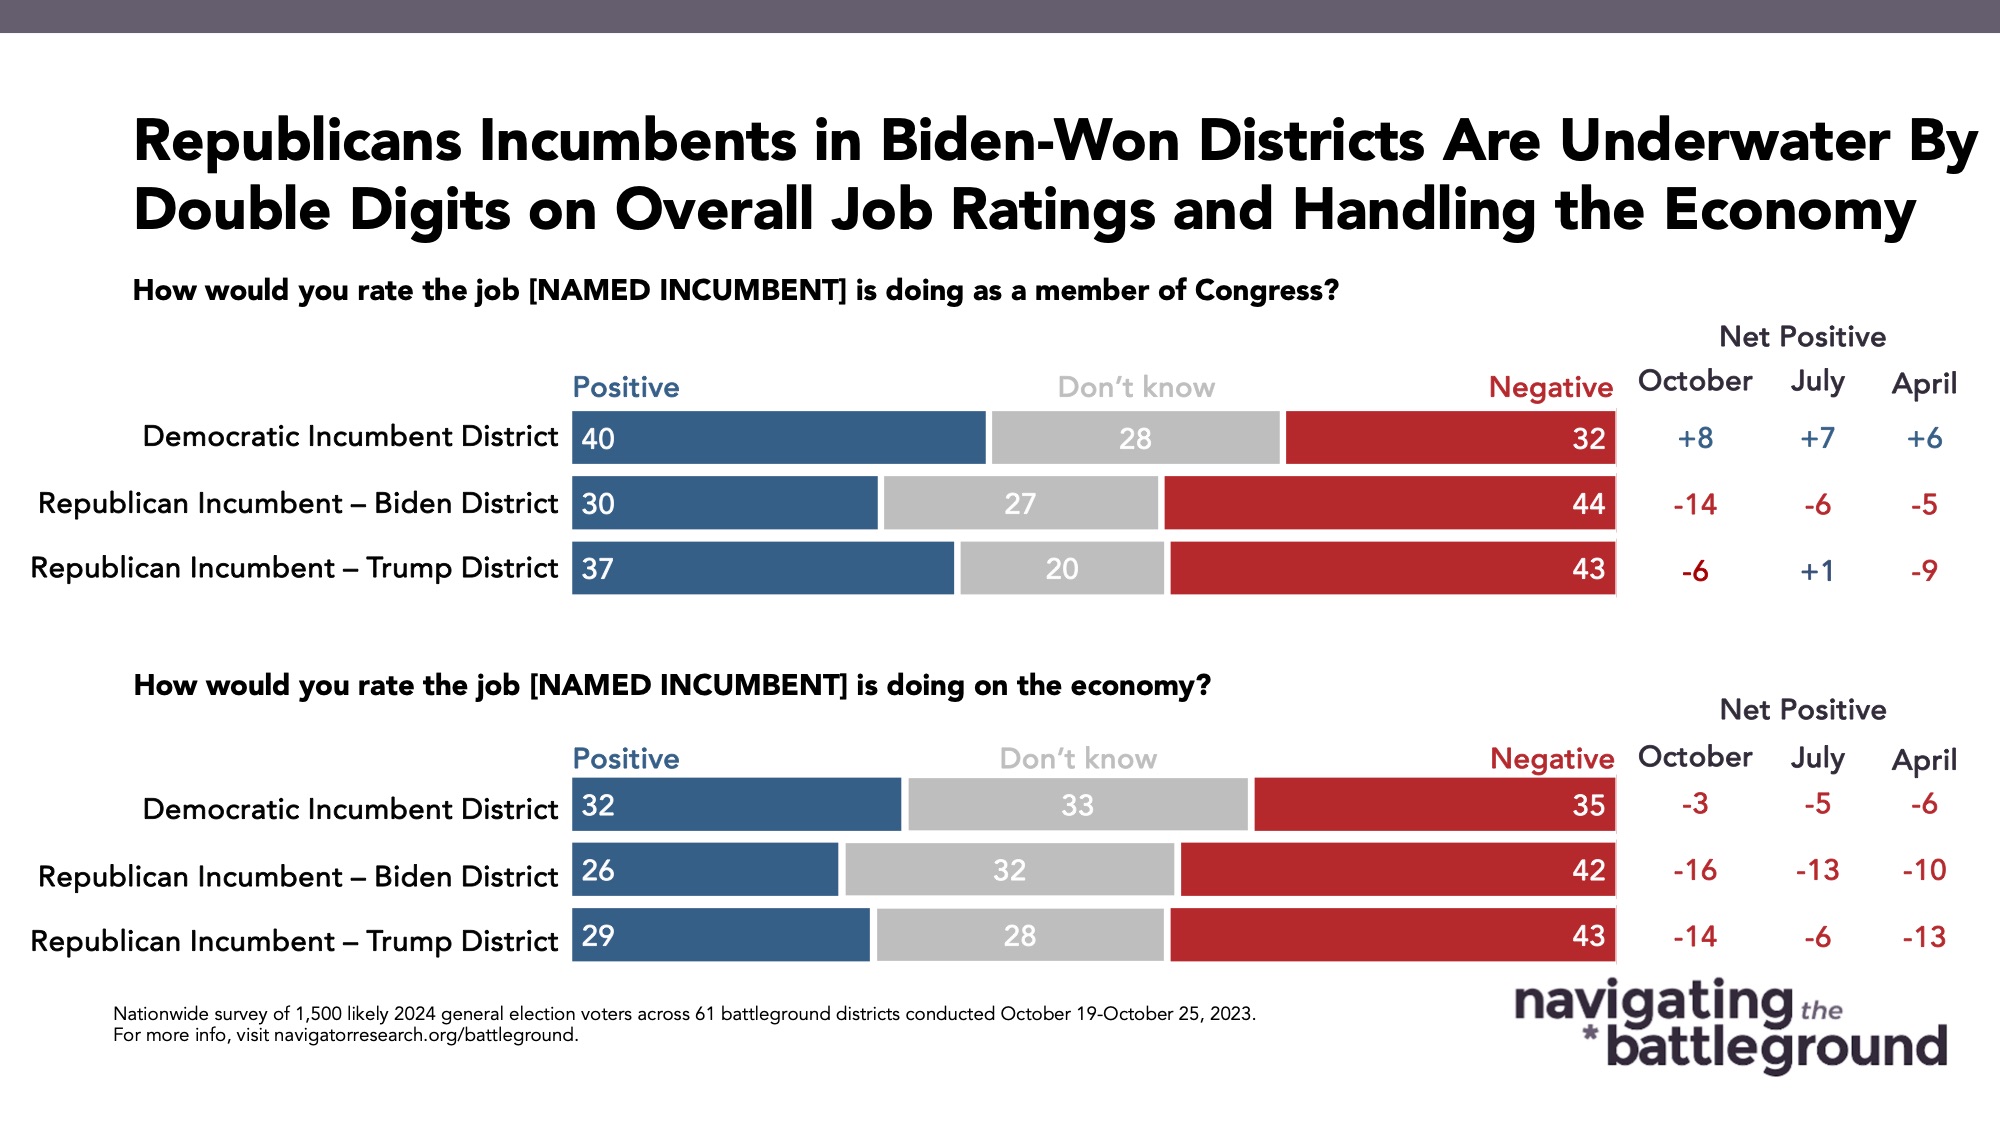
Democratic incumbents in the battleground are net positive in both favorability and approval among their constituents, while Republican incumbents earn net negative ratings, particularly in battleground districts won by President Biden in 2020. Republican incumbents in Biden-won districts have negative favorability among their constituents (net -10; 34 percent favorable – 44 percent unfavorable) and are even more net negative when it comes to assessing their handling of the economy (net -14; 30 percent positive – 44 percent negative).
- These are the lowest ratings since our first battleground survey in April. Republican incumbents in Trump-won districts are also underwater among their constituents on both favorability (net -4; 41 percent favorable – 45 percent unfavorable) and approval (net -6; 37 percent positive – 43 percent negative). By contrast, Democratic incumbents in the battleground have been consistently above water on both favorability and approval throughout our battleground tracking, including being 9 points above water on favorability in this survey (42 percent favorable – 33 percent unfavorable) and 8 points above water on job approval (40 percent positive – 32 percent negative).
- By 48 points, 68 percent of battleground constituents think Republicans in Congress have prioritized the wrong things compared to just 20 percent who think they have prioritized the right things, a 32-point net shift from July (37 percent prioritized the right things – 53 percent prioritized the wrong things).
- Differences in economic approval are more negative across the board: while Democratic incumbents have held steady job ratings, they are slightly underwater (net -3; 32 percent positive – 35 percent negative). However, Republican incumbents in both Biden-won and Trump-won districts fare much worse than Democratic incumbents on economic approval: Republican incumbents in Biden-won districts are 16 points underwater (26 percent positive – 42 percent negative) and Republican incumbents in Trump-won districts are 14 points underwater (29 percent approve – 43 percent disapprove).
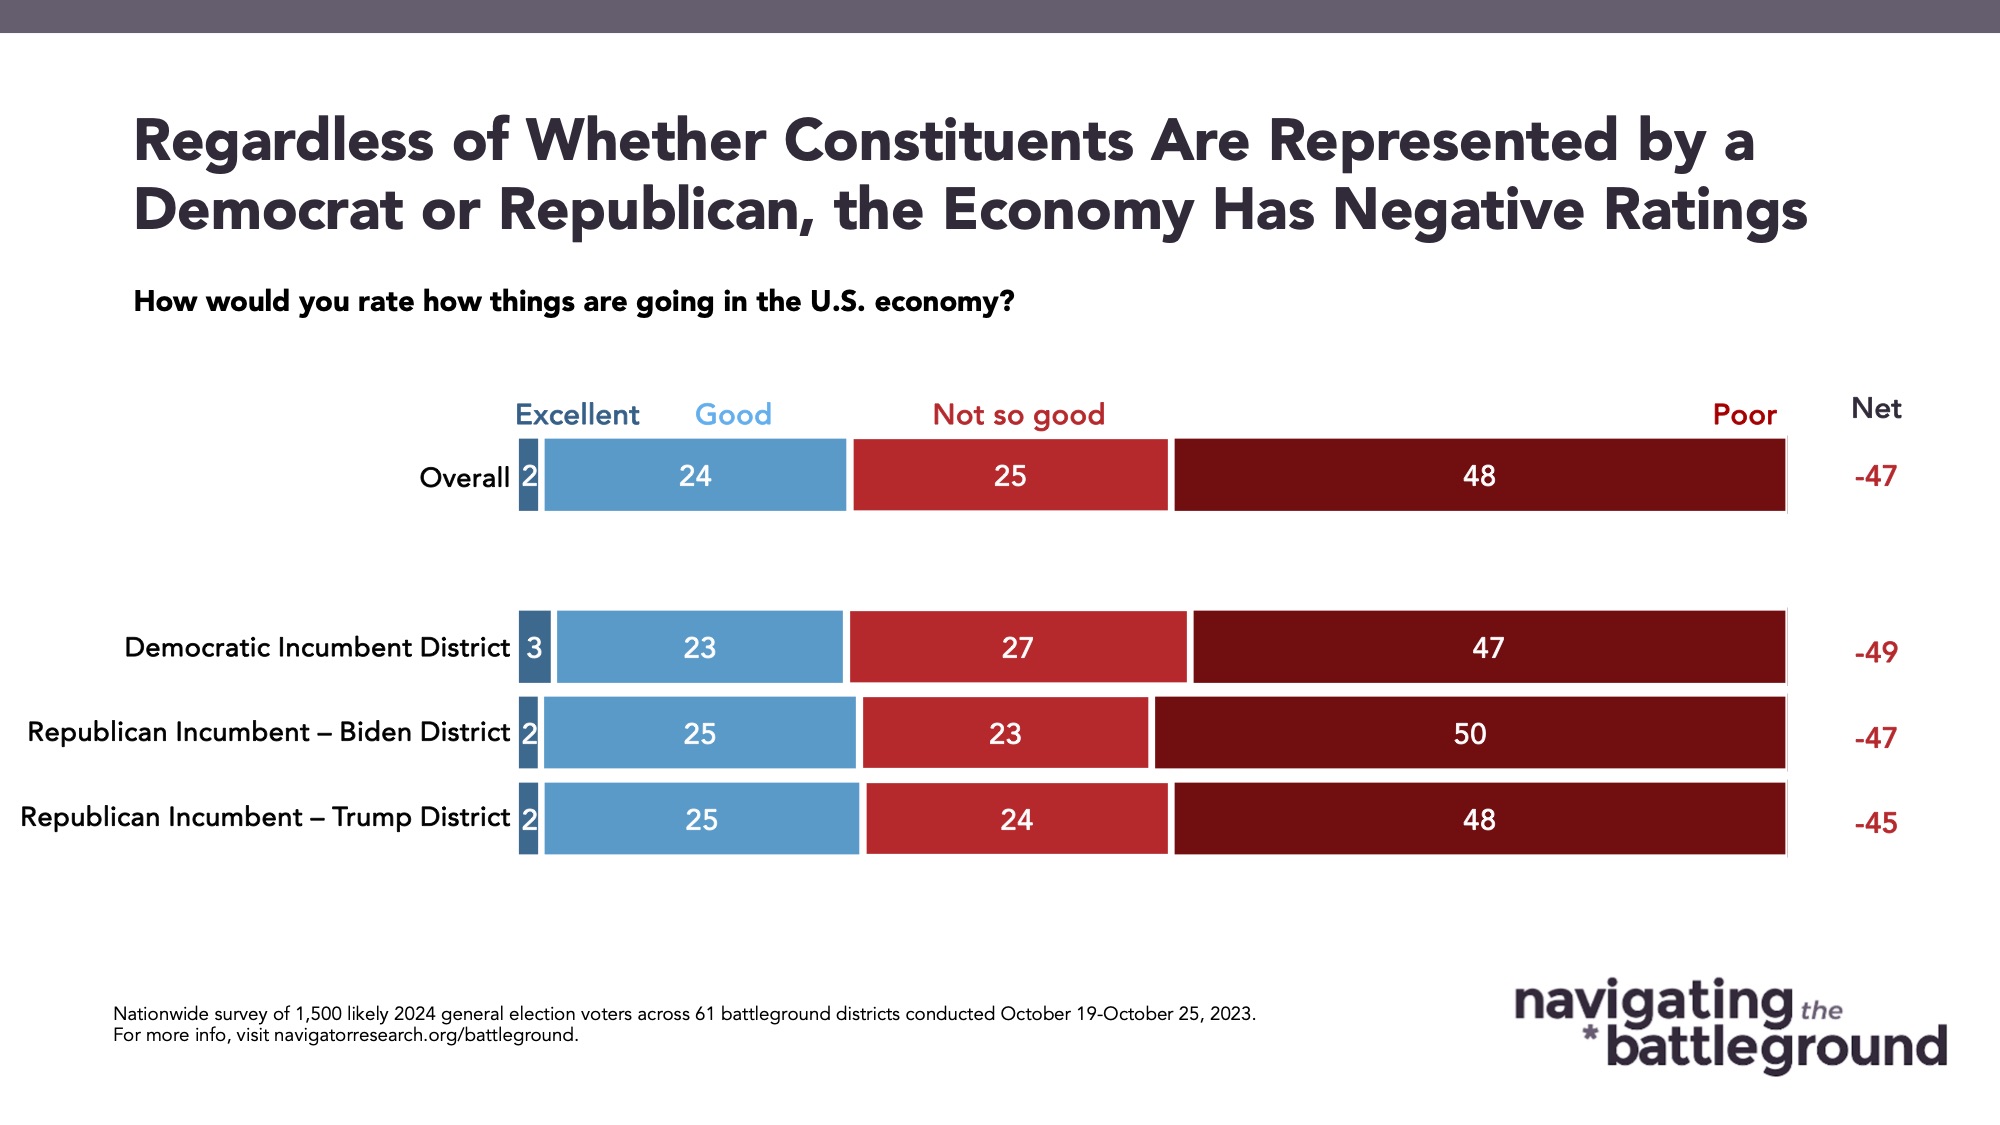
Regardless of the party of a battleground district incumbent, constituents rate the economy negatively.
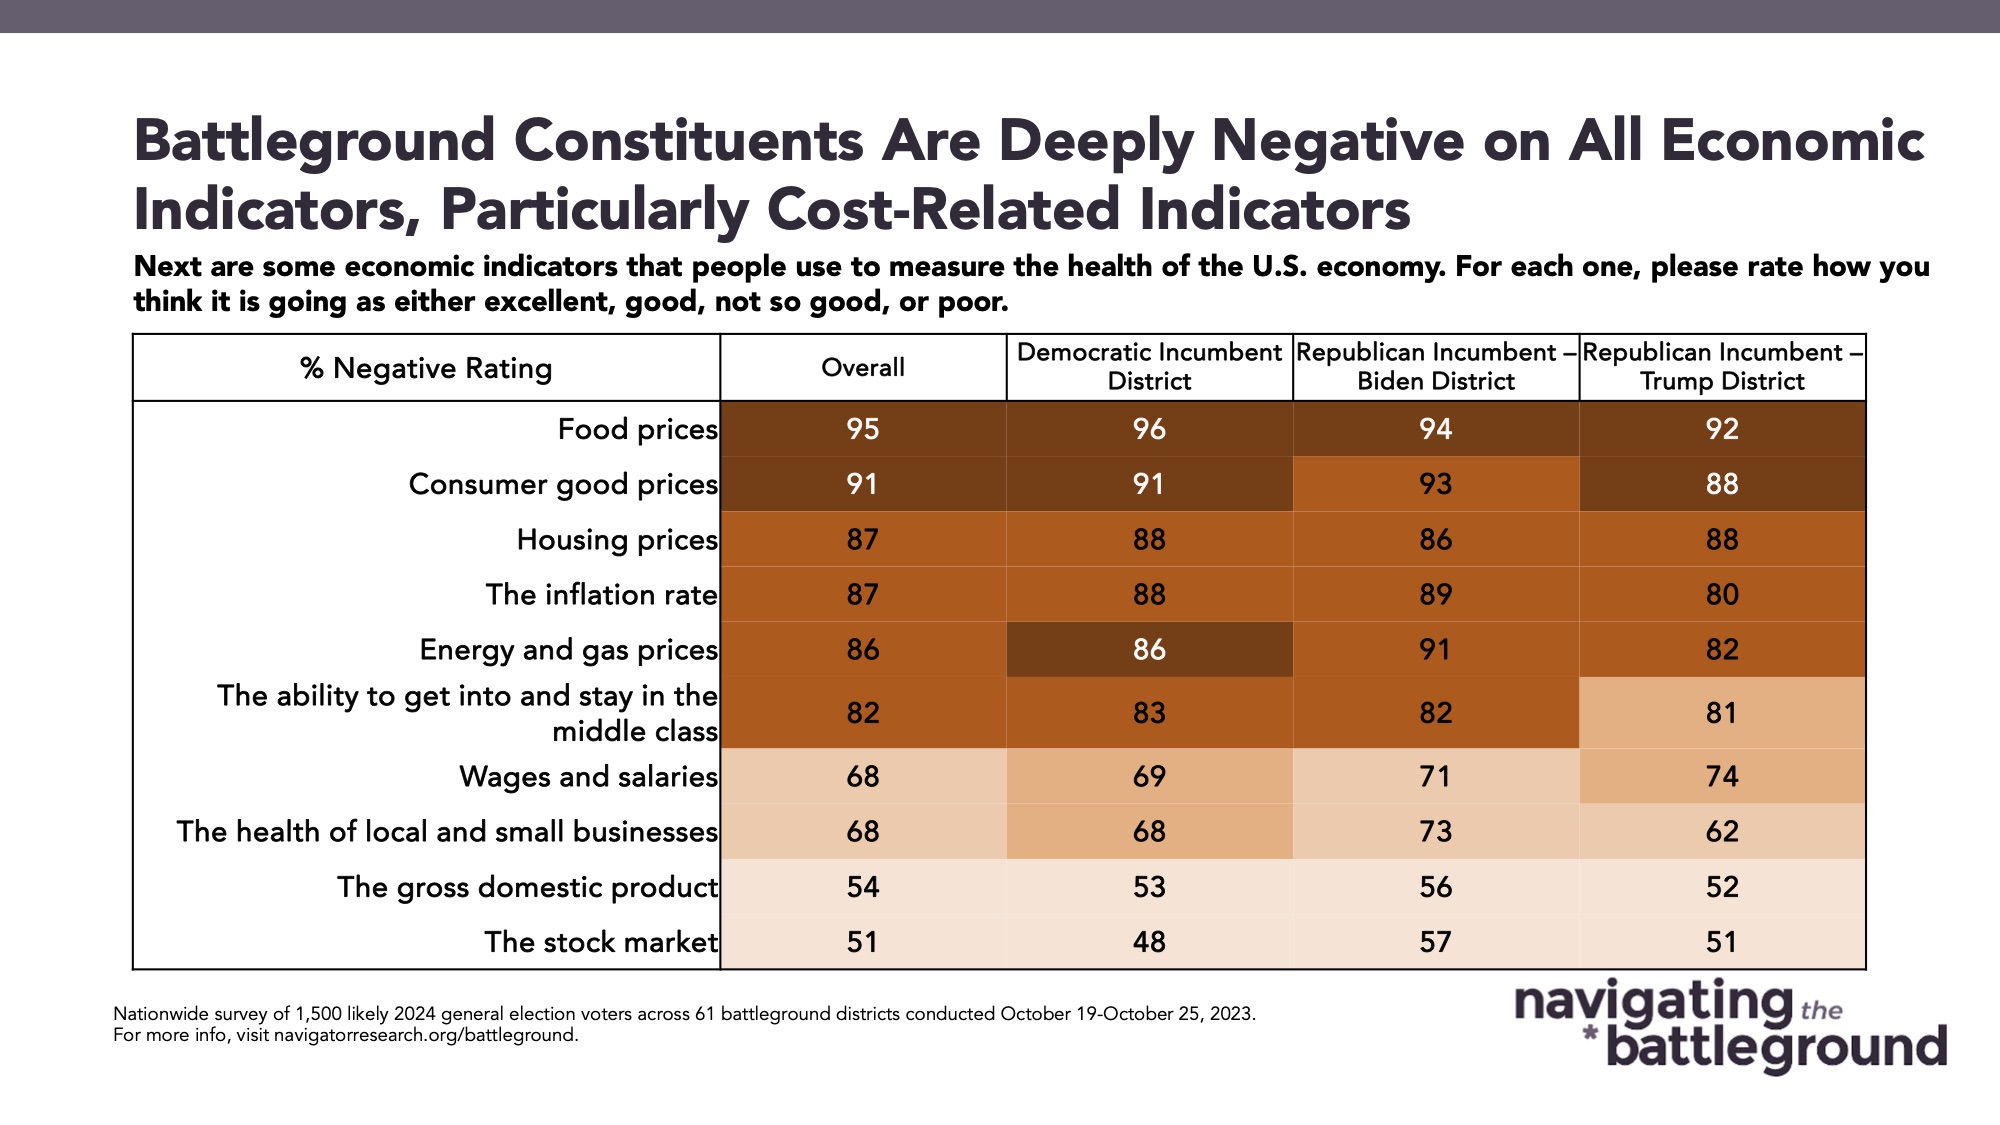
48 percent of Americans in the battleground say the economy is doing poorly, with an additional 25 percent saying the economy is “not so good.” While economic ratings are pretty consistent between Democratic and Republican incumbent districts, there is slightly more negative intensity among those in Biden-won Republican incumbent districts with 50 percent of Americans in those districts giving the economy a “poor” rating. There is also consistency across district types when Americans in the battleground are asked to identify specific economic pain points: 96 percent of Americans in Democratic incumbent districts identify food prices as a negative indicator of the health of the economy, followed by consumer good prices (91 percent) and housing prices (88 percent). The same holds true for both Republican incumbent district types: food prices remain the top concern in Republican incumbent districts that Biden won (94 percent) and in Republican incumbent districts that Trump won (92 percent).
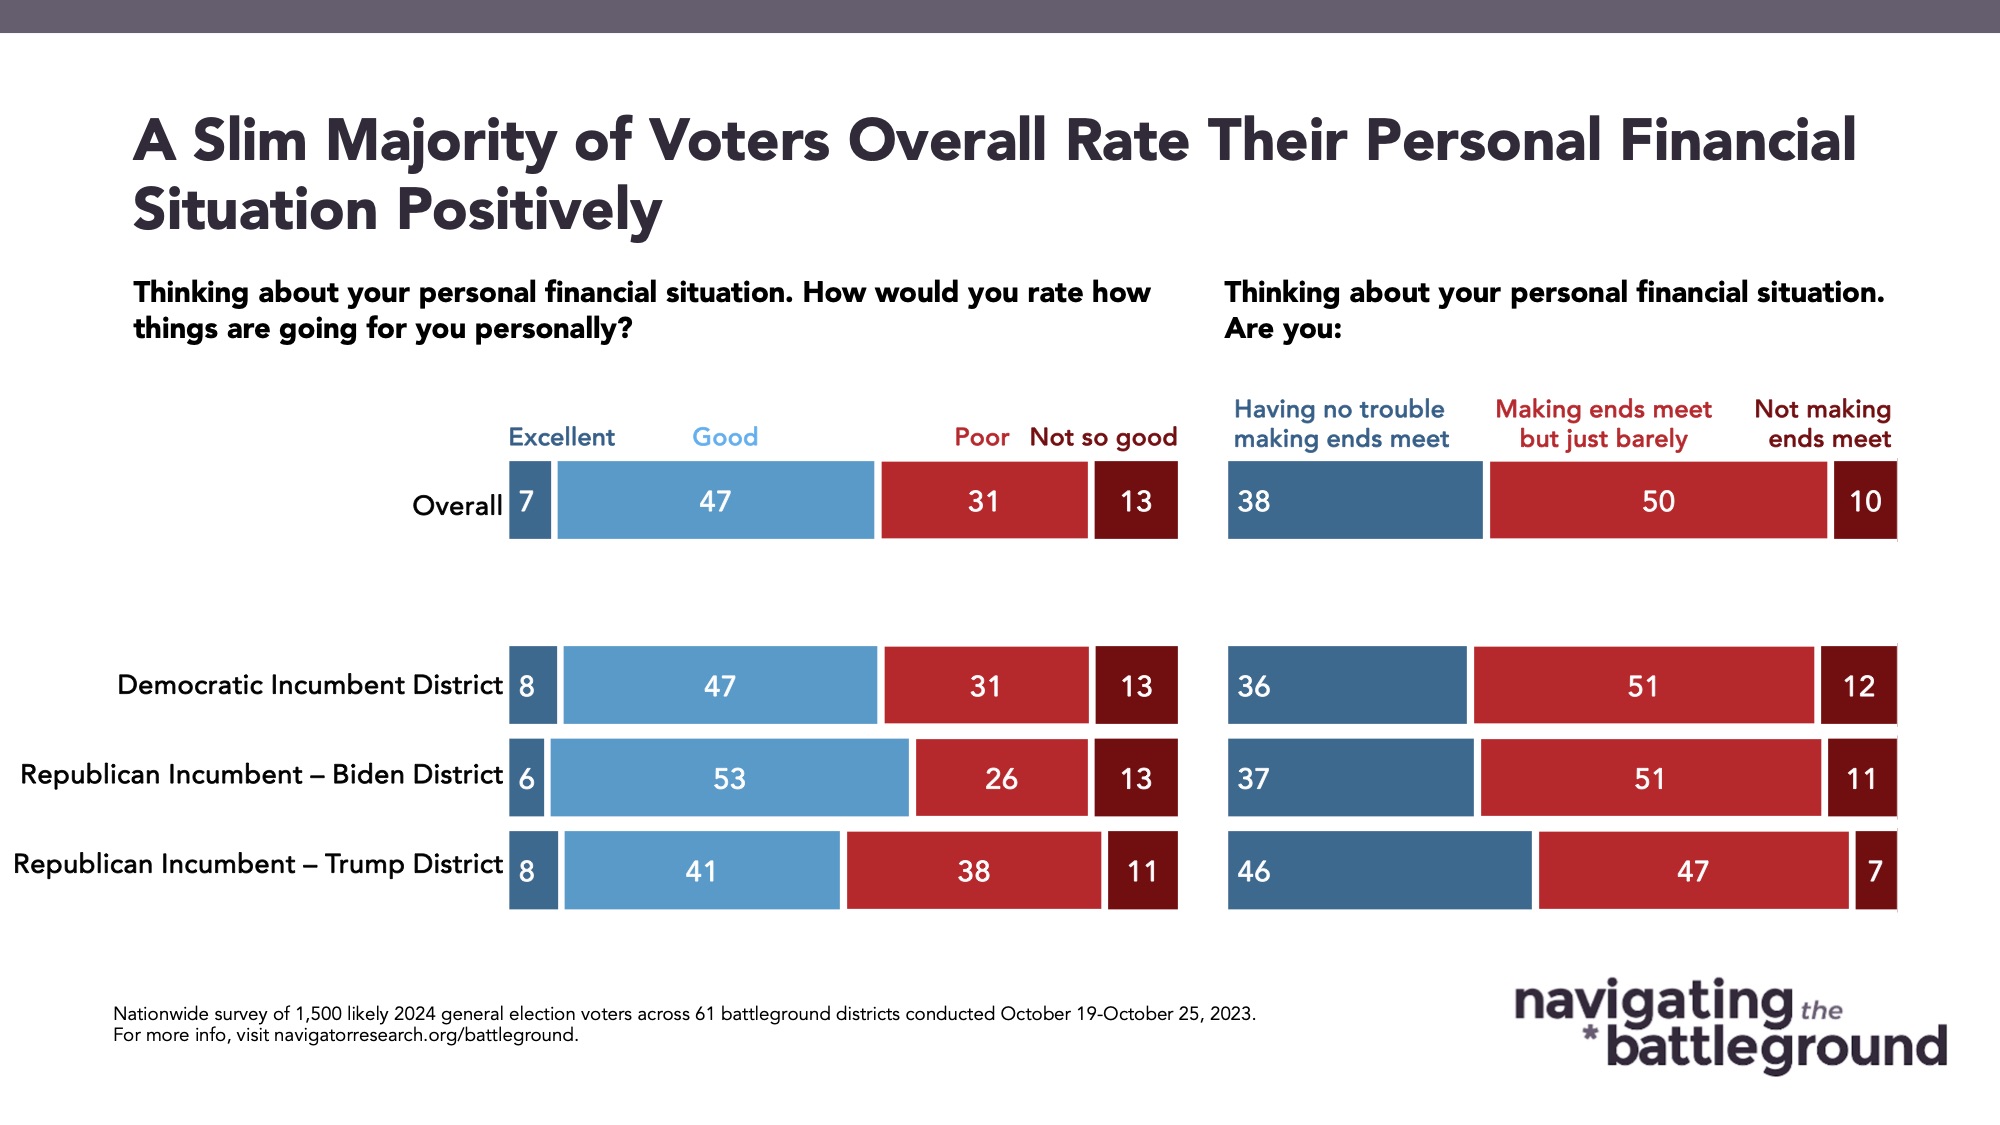
Constituents in the battleground are more split on ratings of their personal financial situations.
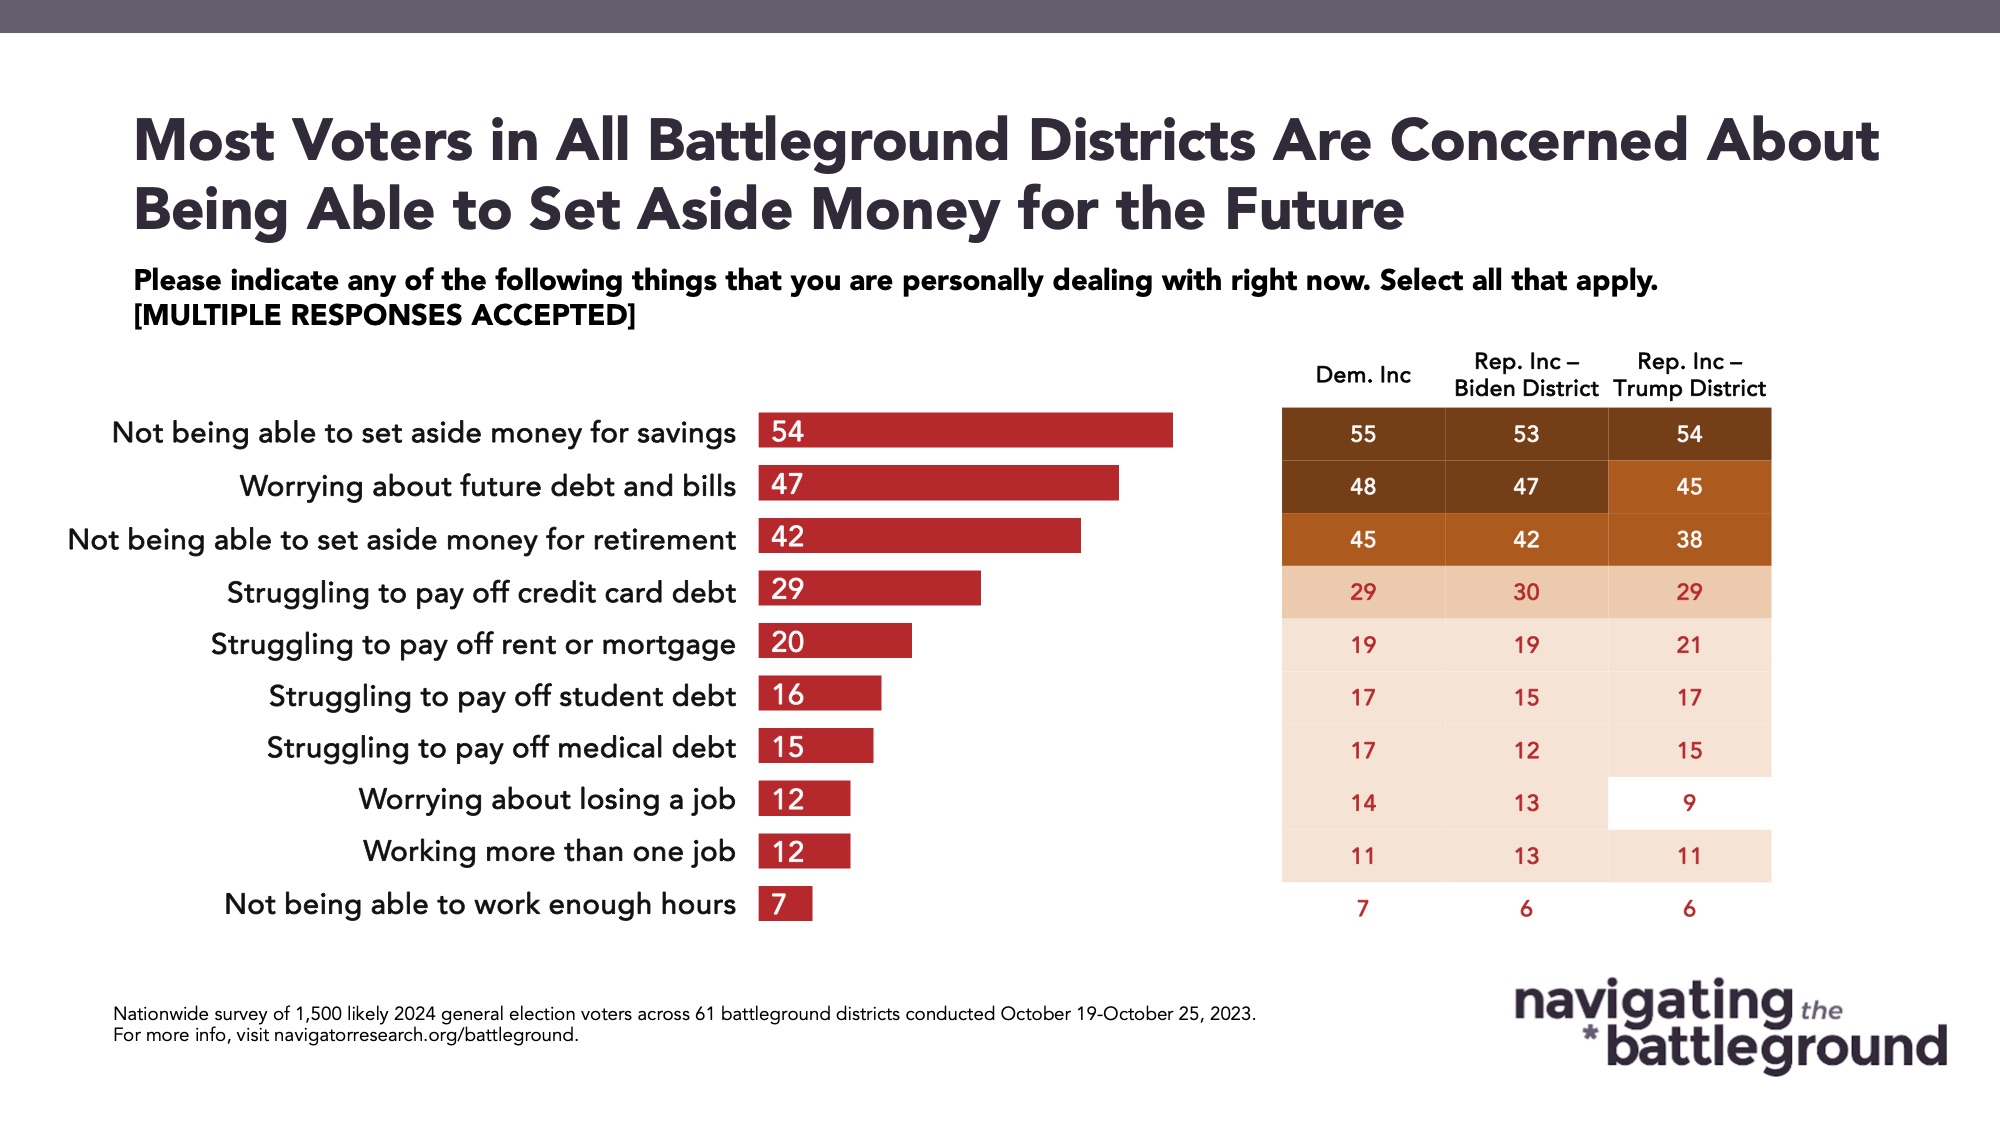
A majority of battleground constituents rate their personal economic situation positively (54 percent say they are going “excellent” or “good”). However, when asking them specifically about how well they’re able to make ends meet, 60 percent of constituents across district types say they are “just barely making ends meet” or “not making ends meet.” Although a majority of those in Trump-won Republican incumbent districts say they are just barely or not making ends meet, they are much more likely than the other district types to have constituents who say they’re “having no trouble making ends meet,” with 46 percent of Americans in those districts saying so (compared to 37 percent of those in Republican incumbent districts that Biden won and 36 percent in Democratic incumbent districts). Across district types, the most acute pain points constituents are feeling in their personal financial situation are “not being able to set aside money for savings” (54 percent) and “worrying about future debt and bills” (47 percent).
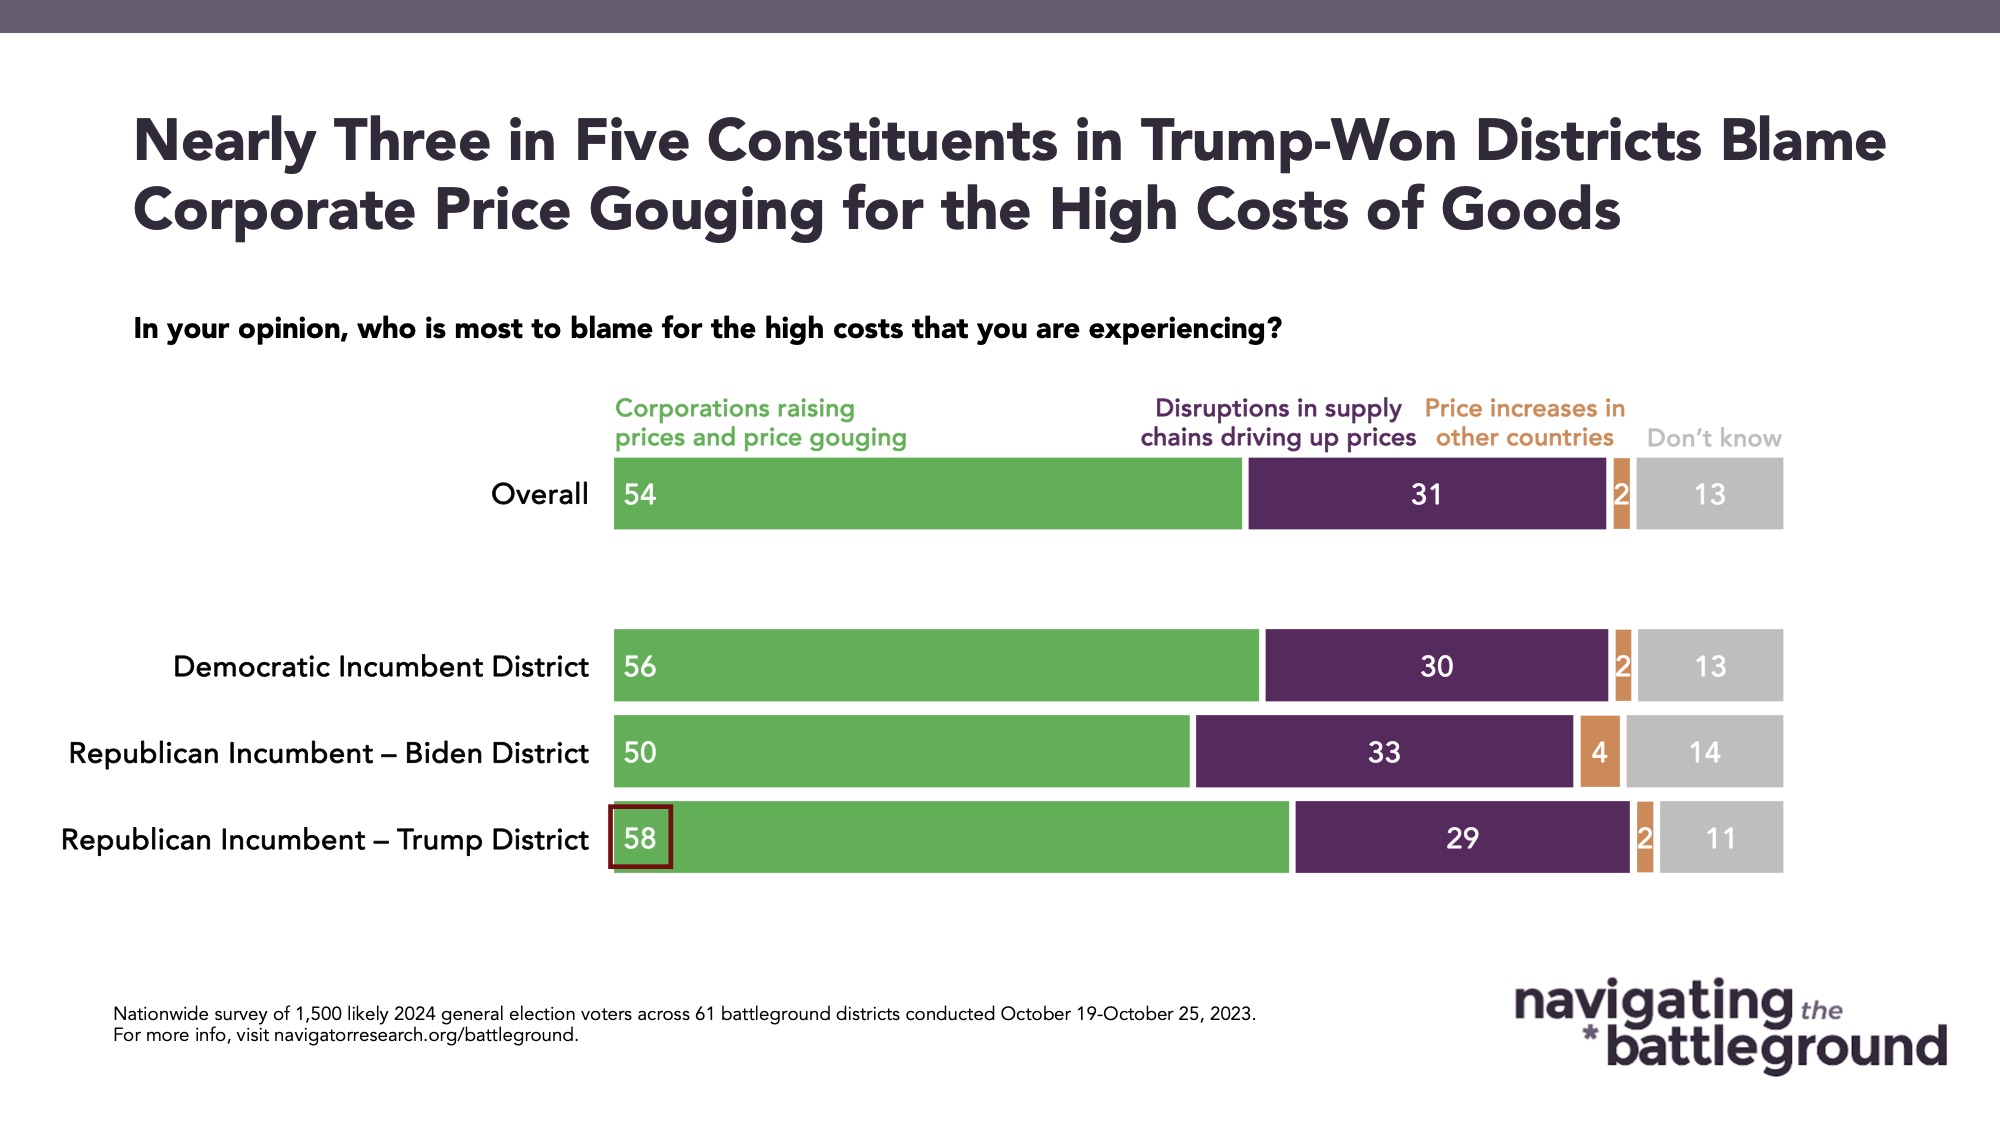
- When asked to identify what specifically was to blame for the high costs they were experiencing, constituents in the battleground across district types identified corporations raising prices and price gouging as the primary cause (54 percent), with constituents in Trump-won Republican districts being the most likely to blame corporations (58 percent).
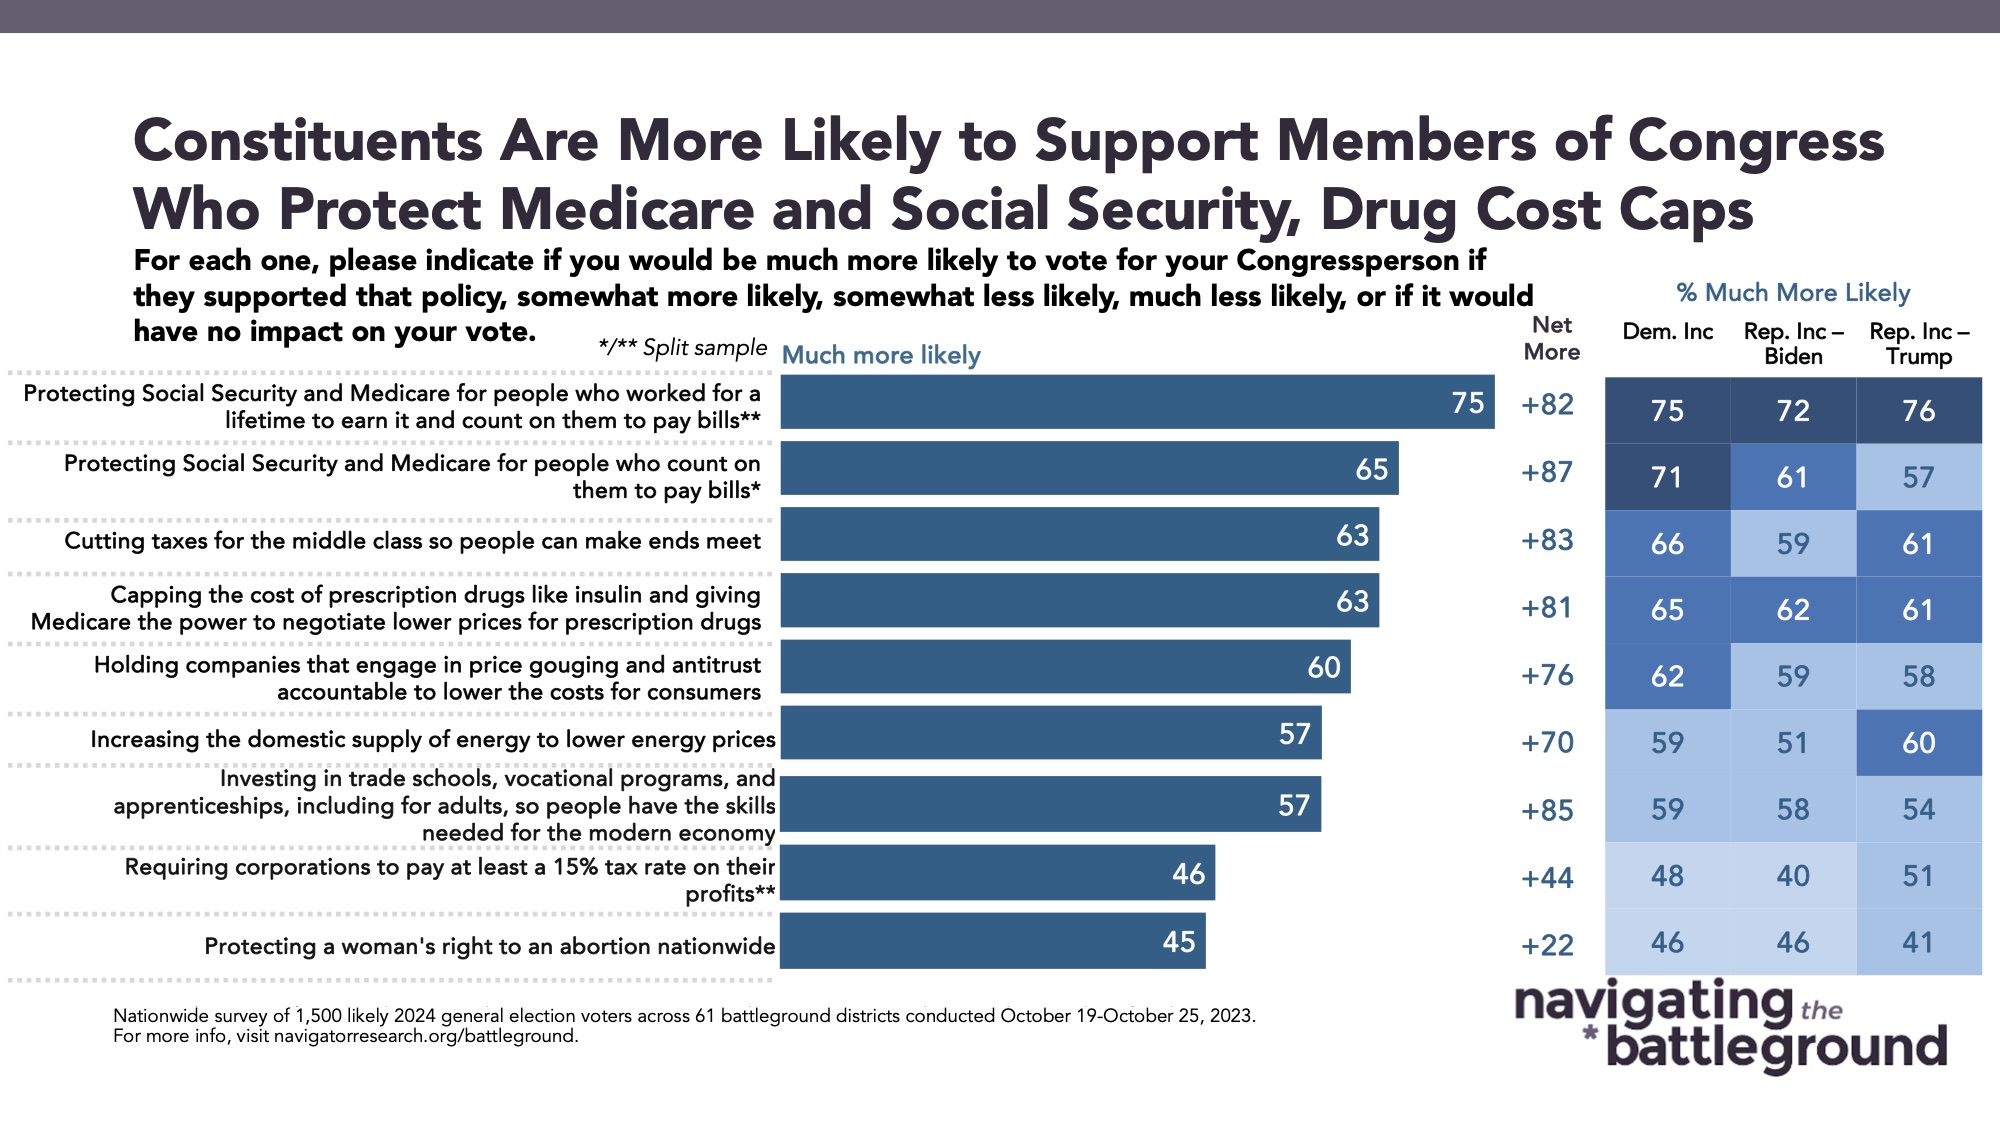
Battleground constituents are more likely to support members of Congress who favor protecting Social Security and Medicare.
Battleground constituents are more likely to support their member of Congress if they support protections for Social Security and Medicare, capping prescription drug costs, and cutting middle class taxes. 75 percent of constituents across the battleground say they’re much more likely to support their member of Congress if they support protecting Social Security and Medicare, including 76 percent of constituents in Trump-won Republican Incumbent districts, 75 percent in Democratic incumbent districts, and 72 percent in Biden-won Republican incumbent districts. Nearly two in three battleground constituents also say that “cutting taxes for the middle class” and “capping the cost of prescription drugs like insulin” would make them more likely to support their member of Congress (63 percent each). Each of cutting taxes for the middle class and capping drug costs have higher levels of intensity in Democratic incumbent districts (66 percent and 65 percent, respectively) than Republican incumbent districts (60 percent and 62 percent, respectively).
- In a split-sample experiment, constituents across the battleground were “much” more likely to support their member of Congress if they supported “protecting Social Security and Medicare for people who worked for a lifetime to earn it and count on them to pay their bills” (75 percent) than when just framed as “protecting Social Security and Medicare for people who count on them to pay bills” without the language about working for a lifetime to earn it (65 percent).
About The Study
Impact Research conducted public opinion surveys among a sample of 1,500 likely 2024 general election voters from October 19-25, 2023. The survey was conducted by text-to-web (100 percent). Respondents were verified against a voter file and special care was taken to ensure the demographic composition of our sample matched that of the 61 congressional districts included in the sample across a variety of demographic variables. The margin of error for the full sample at the 95 percent level of confidence is +/- 2.5 percentage points. The margin for error for subgroups varies and is higher.

