Exit Poll: Vote History & Political Engagement
This Navigator Research report is the seventh in a series of releases of findings from our post-election survey among 5,000 self-reported 2024 general election voters. This release focuses on how Americans voted in the 2024 election based on their voting history and political engagement, including what issues mattered most when deciding who to vote for, and how vote shares compared to that of the 2020 election.
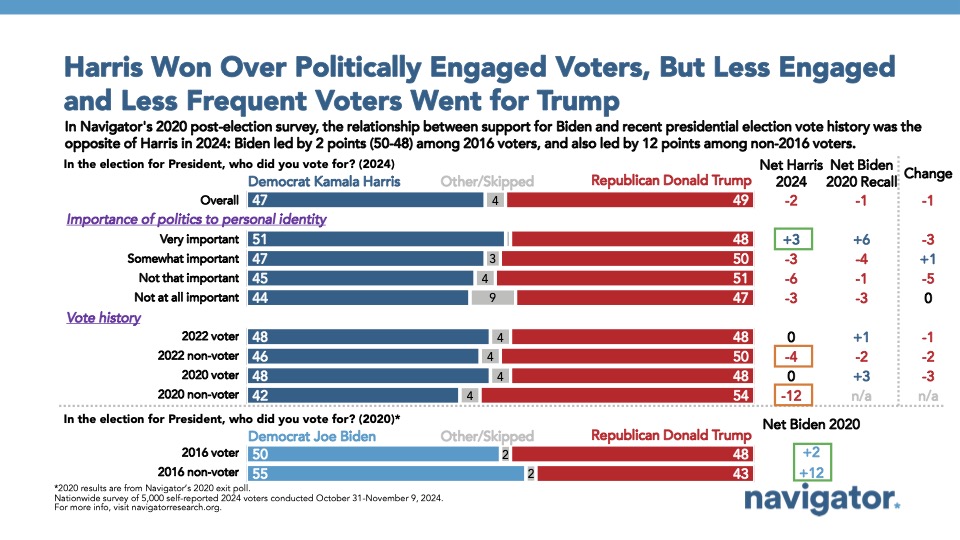
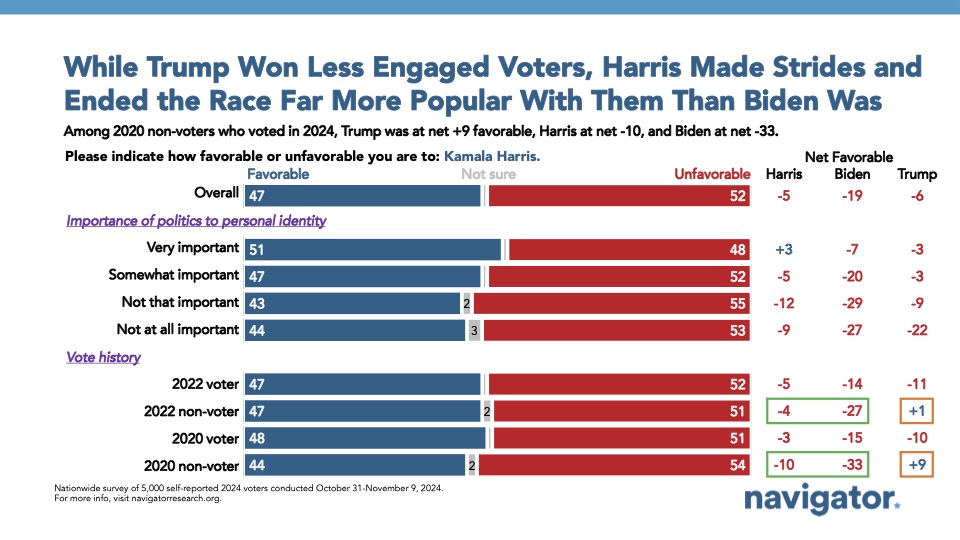
While Harris was able to gain significant ground with less engaged voters, the group ultimately went for Trump.
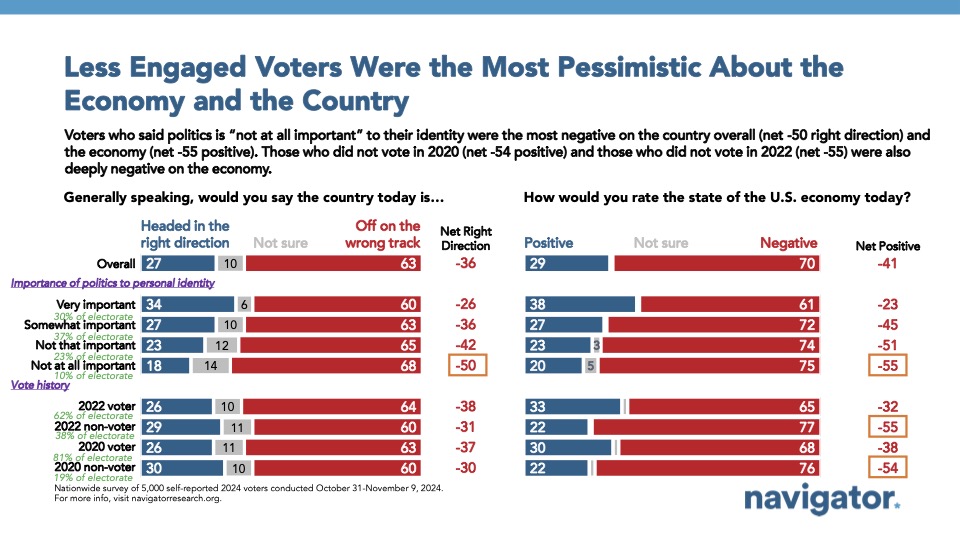
Less engaged voters were more pessimistic about the state of the economy and direction of the country, and were more likely to vote for Trump in the 2024 election. Among those who said politics was “not at all important” to their personal identity, three in four rated the state of the U.S. economy negatively (net -55; 20 percent positive – 75 percent negative) and two in three indicated the country is headed in the wrong direction (net -50; 18 percent right direction – 68 percent wrong direction). Similarly, among those who voted in the 2024 election but did not vote in the 2020 election, 19 percent of the 2024 electorate, 76 percent rated the national economy negatively (net -54; 22 percent positive – 76 percent negative). These less engaged and new voters were more likely to vote for Trump in 2024, with 2020 non-voters voting for Trump by a 12-point margin (net -12; 42 percent Harris – 54 percent Trump), and those who said politics is either “not that important” or “not at all important” to their personal identities voting for Trump by 3-point and 6-point margins, respectively (not at all important; 44 percent Harris – 47 percent Trump, not that important; 45 percent Harris – 51 percent Trump).
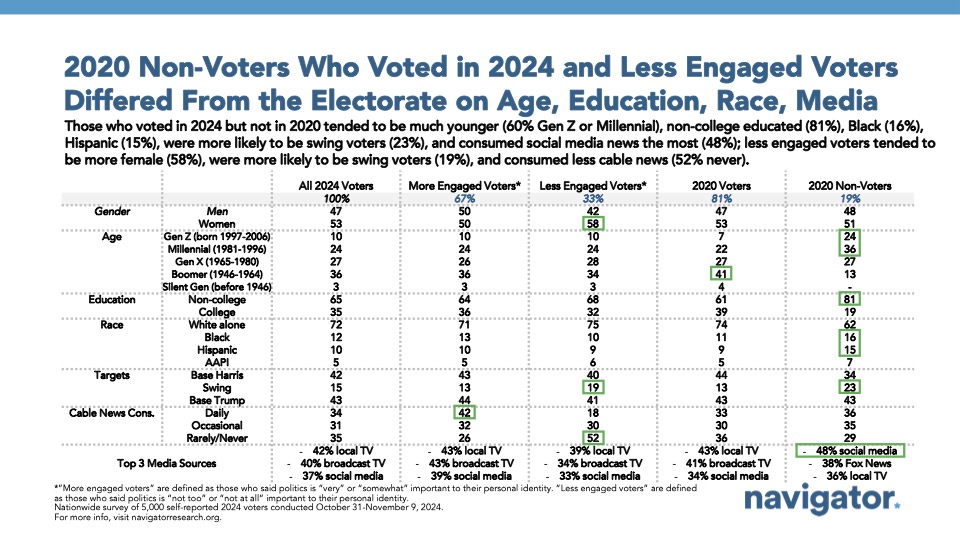
- Among voters who said politics is not important to their personal identity (33 percent of overall electorate), a majority were women (58 percent women – 42 percent men), a majority rarely or never watched cable news (52 percent), and one in five were swing voters in the 2024 election (19 percent).
- Among those who did not vote in 2020 but voted in 2024, 63 percent were under the age of 45, 48 percent got their news from social media, 81 percent were non-college educated, and 23 percent were swing voters.
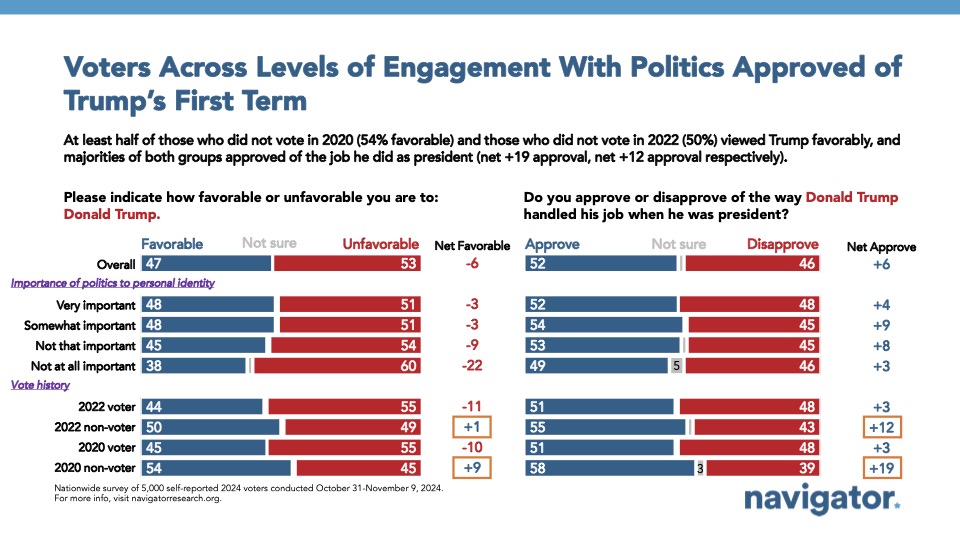
Less engaged voters viewed Trump unfavorably, but approved of his handling of the presidency.
By a 19-point margin, 2020 non-voters retrospectively approved of Trump’s handling of the presidency (58 percent approve – 39 percent disapprove), as did a majority of 2022 non-voters (net +12; 55 percent approve – 33 percent disapprove). Across political engagement, voters were unfavorable to Donald Trump going into the 2024 election, including 60 percent of voters who said politics is “not at all important” to their identity (net -22; 38 percent favorable – 60 percent unfavorable), though among the same group of disengaged voters, a plurality approved of Trump’s handling of the presidency (net +3; 49 percent approve – 46 percent disapprove).
Inflation and the cost of living was the top issue among disengaged voters, as two in three disapproved of Biden’s handling of the economy.
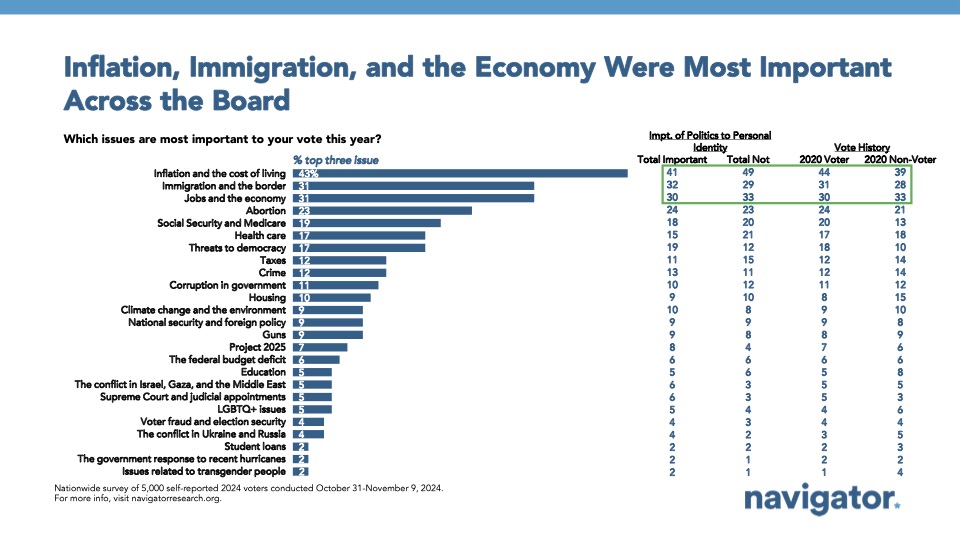
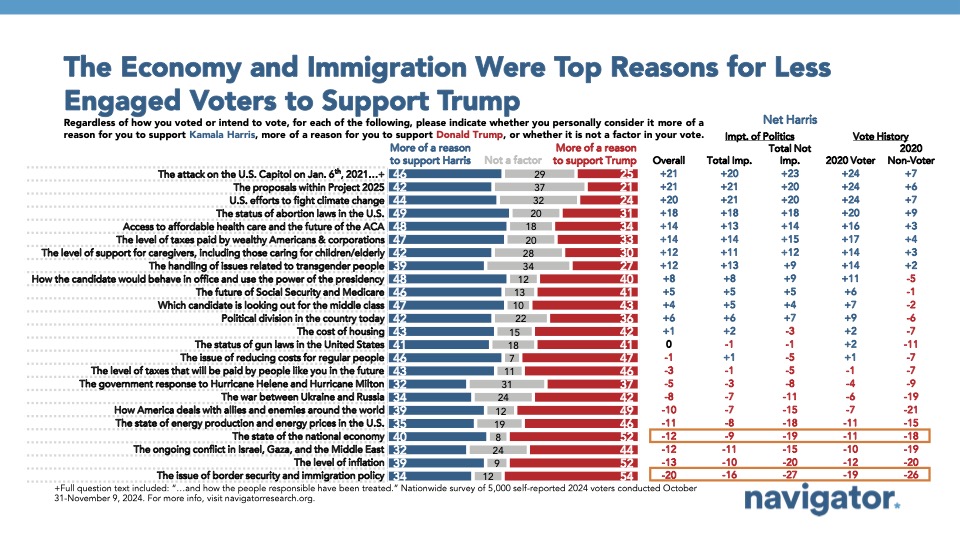
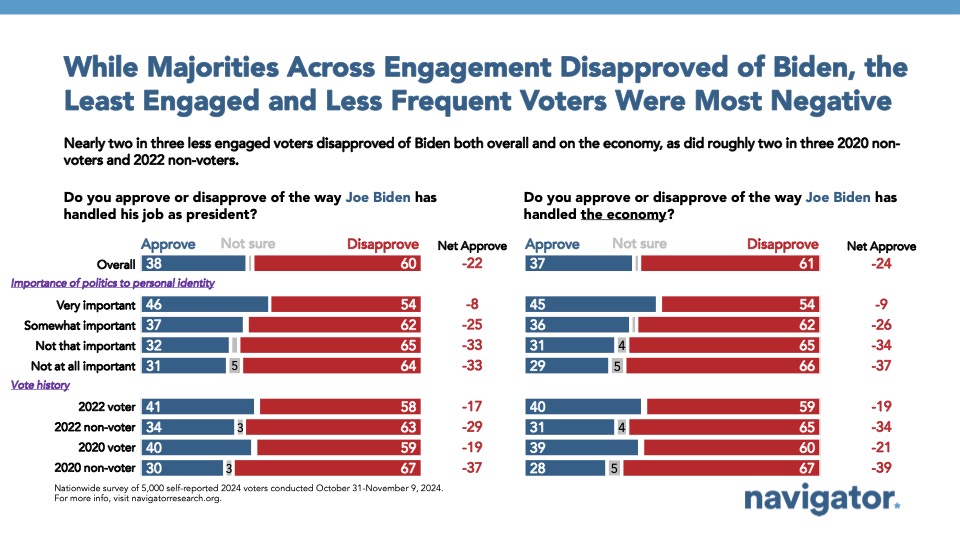
Among voters who said politics is not important to their identity, 49 percent listed inflation and the cost of living as a top issue affecting how they would vote in the 2024 election, followed by jobs and the economy (33 percent), and immigration (29 percent). Among this group, two in three disapproved of Biden’s handling of the economy (66 percent disapprove – 30 percent approve) and saw the state of the national economy as more of a reason to support Trump than Harris (net -19; 35 percent more of a reason to support Harris – 54 percent more of a reason to support Trump). Across engagement, the level of inflation was also seen as more of a reason to support Trump, including among 2020 non-voters by a 20-point margin (35 percent more of a reason to support Harris – 55 percent more of a reason to support Trump).
- 2020 non-voters disapproved of Biden’s handling of the economy by a 39-point margin (28 percent approve – 67 percent disapprove) and rated him unfavorably by 33 points (32 percent favorable – 65 percent unfavorable). Kamala Harris had better standing among 2020 non-voters than President Biden going into Election Day (44 percent favorable – 54 percent unfavorable), however Trump was viewed favorably among this group by 9 points (54 percent favorable – 45 percent unfavorable).
About The Study
Global Strategy Group conducted an online survey of 5,000 registered voters from October 31st through November 9th, 2024, with respondents recruited from opt-in online panel vendors. Of that 5,000, 4,784 respondents were verified against a voter file (and the other 216 were voters who said they were registering before voting if interviewed before Election Day) and special care was taken to ensure the demographic composition of the sample reflected that of the expected 2024 electorate. The vote shares for Kamala Harris, Donald Trump, House and Senate Democrats, and House and Senate Republicans were also adjusted to reflect a preliminary estimate of the vote in the 2024 election. The margin of error for the full sample at the 95 percent level of confidence is +/- 1.4 percentage points. The margin of error for subgroups varies and is higher.
