
Poll: Halloween Candies
This Navigator Research report contains polling data on how Americans view different Halloween candies, including those that are most and least liked, and differences in preference by partisanship, age, and region of the country.
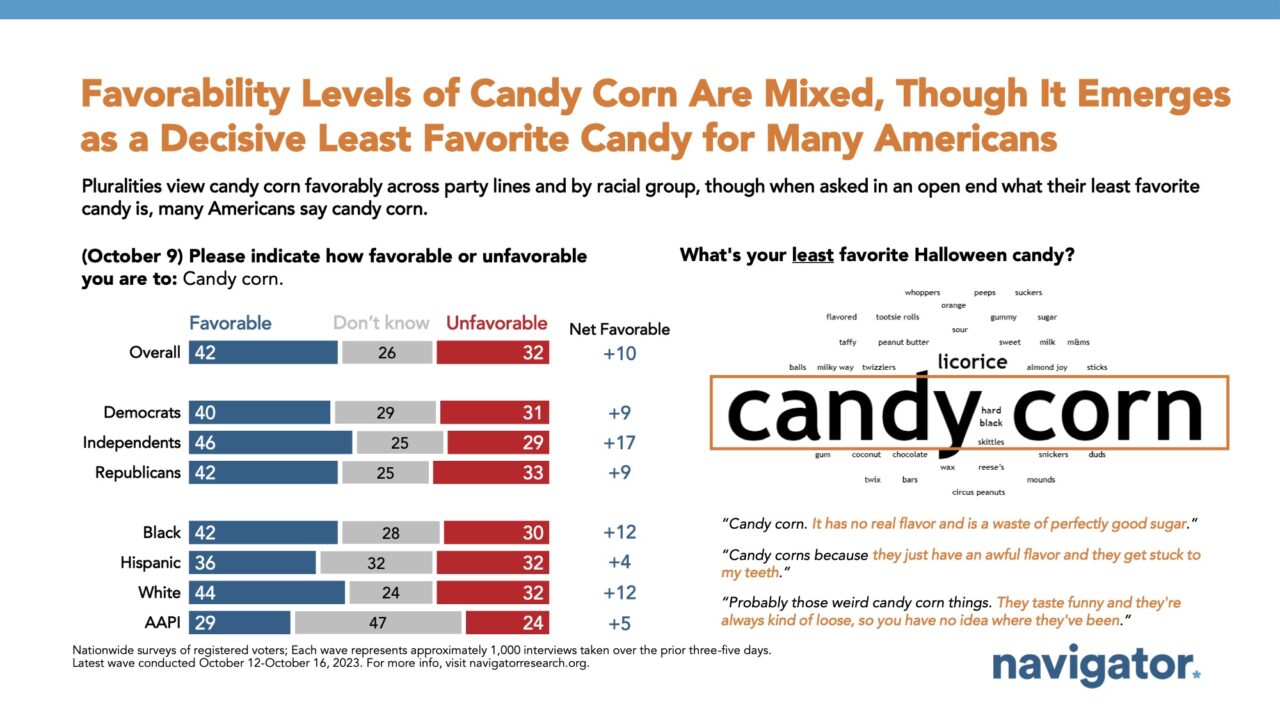
Reese’s Peanut Butter Cups prevail as Americans’ most favorite Halloween candy, while Snickers comes in a distant second.
Nearly three in ten Americans say Reese’s Peanut Butter Cups are their favorite Halloween candy (29 percent). This is consistent across party lines, including 29 percent of Democrats, 28 percent of independents, and 28 percent of Republicans. Other popular candies include Snickers at second (11 percent), followed by a three-way tie for third between M&M’s, Kit Kats, and candy corn (8 percent each).
- Americans living in households earning more than $100,000 per year are more likely to favor Reese’s (33 percent) compared to those living in households earning less than $50,000 per year (29 percent). Further, very conservative Republicans are slightly more likely to enjoy Reese’s (30 percent) compared to non-very conservative Republicans (27 percent), but Democrats are consistent regardless of whether they identify ideologically as liberal (29 percent) or moderate/conservative (30 percent).
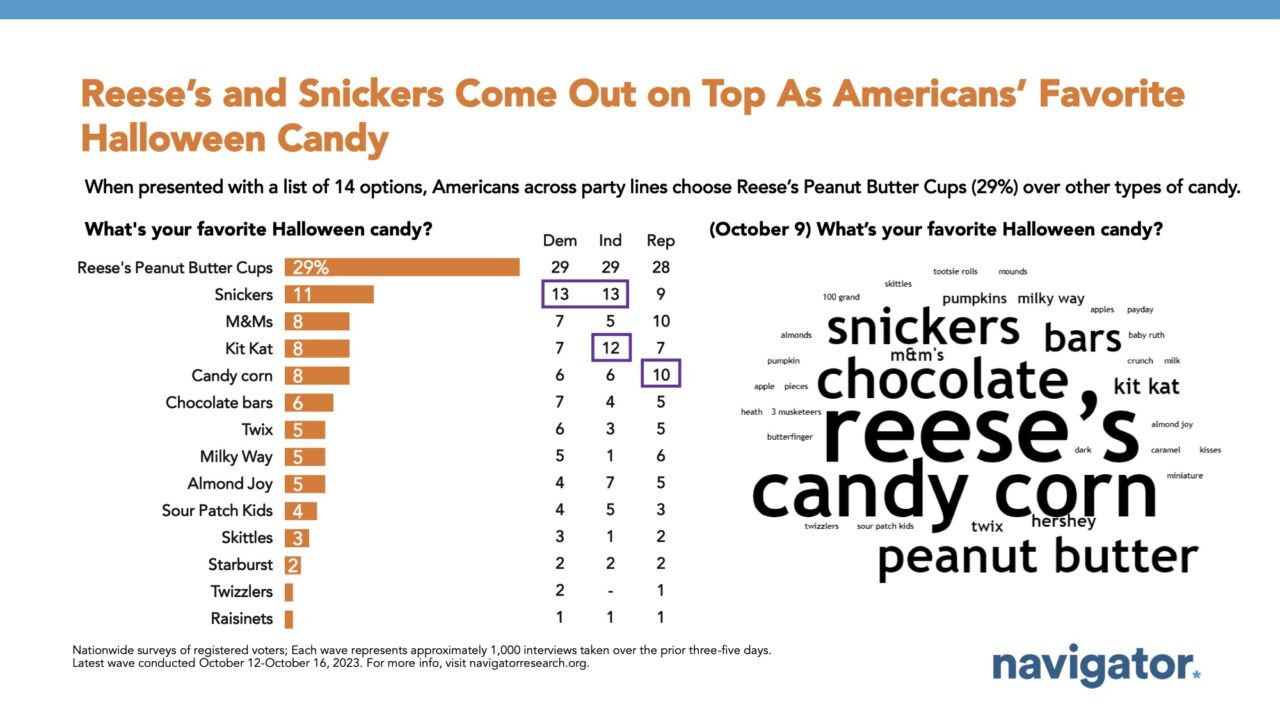
While candy corn has a net positive favorable rating, it is also most commonly cited as Americans least favorite Halloween candy.
Candy corn has a net positive favorability rating among Americans, but is also most likely to be cited as Americans’ least favorite Halloween candy. By a 10-point margin, Americans hold a more favorable view of candy corn than negative (42 percent favorable – 32 percent unfavorable), including net positive ratings across partisanship (net +9 among Democrats, net +9 among Republicans, and net +17 among independents). Ratings of candy corn are particularly high among those who report not voting in the 2020 presidential election (net +22; 50 percent favorable – 28 percent unfavorable) compared to single-digit net positive ratings among Trump voters (net +9) and Biden voters (net +8). Independent women are also more favorable to candy corn (net +20; 50 percent favorable – 30 percent unfavorable) than any other group.
- However, in an open-end question when asked to name their least favorite Halloween candy, an overwhelming share cited “candy corn,” with a few mentions of “licorice” as well.
Preference for some candies, like Kit Kats and Twix, varies by age group.
Across age groups, a greater share of younger Americans favor Kit Kats and Twix compared to those 45 years or older, as Snickers and candy corn are more favored within this age bracket. Americans under the age of 35 are more likely to favor Kit Kats (12 percent) compared to those older than 45 (7 percent), which also holds true with Twix as one in ten younger Americans say it is their favorite candy (10 percent) compared to only 2 percent over the age of 45 years old.
- Americans living in the Northeast have a stronger preference for Reese’s (31 percent), chocolate bars (8 percent), and Skittles (7 percent); while Americans living in the South still rate Reese’s as their most favorite candy (29 percent), secondary favorites include Milky Way and Sour Patch Kids at higher rates than the rest of the country (5 percent, and 4 percent respectively).
Reese’s is the favorite candy among both mothers and fathers, but there are discrepancies between them on the second most favored candy.
Among those who are parents or guardians, Reese’s remains the most favorite candy, including one in four moms and dads who say the same (25 percent each). However, the top second place candies for moms include M&M’s (10 percent, compared to 3 percent of dads), Twix (9 percent compared to 3 percent of dads), and Candy Corn (8 percent, compared to 12 percent of dads). Conversely, the favorite second-place candies among dads excluding Reese’s include Snickers (17 percent, compared to 7 percent of moms), candy corn (12 percent) and Sour Patch Kids (8 percent, compared to 7 percent of moms).