Poll: Presidential Election & the U.S. Political Landscape
This Navigator Research report contains polling data on the latest perceptions of the political landscape, including how Americans view the political parties, what they are hearing about key political figures, and their expectations about the outcome of the 2024 presidential election.
Seven in ten Americans are hearing news about both Harris and Trump, though more are hearing negative news about Trump.
72 percent of Americans say they have seen, read, or heard news about Donald Trump, with 68 percent saying they are hearing at least some negative news about him. The same share of Americans have heard news about Kamala Harris (72 percent), with 63 percent saying they are hearing at least some positive news about her and only 47 percent report hearing some negative news about her.
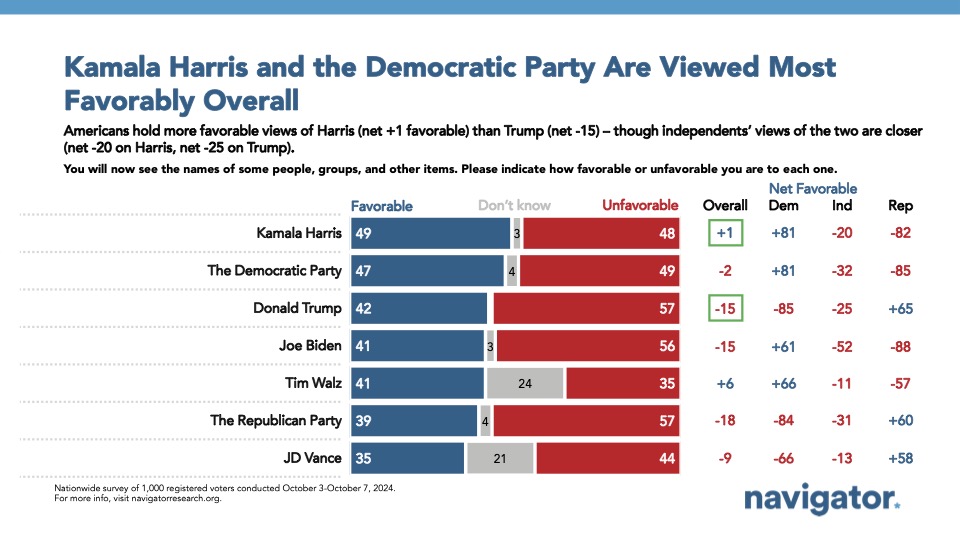
- Harris’ favorability ratings remain nearly evenly split (49 percent favorable – 48 percent unfavorable) while Trump’s favorability rating is underwater by 15 points (42 percent favorable – 57 percent unfavorable).
The Democratic Party is viewed net 16 points more favorably than the Republican Party.
The Republican Party is viewed unfavorably by 18 points (39 percent favorable – 57 percent unfavorable), while the Democratic Party is viewed unfavorably by just 2 points (47 percent favorable – 49 percent unfavorable). A majority of independents view both parties unfavorably by near identical margins, including the Democratic Party by 32 points (26 percent favorable – 58 percent unfavorable) and the Republican Party by 31 points (26 percent favorable – 57 percent unfavorable). One in five Republicans view the Republican Party unfavorably (net +60; 79 percent favorable – 19 percent unfavorable) compared to only one in ten Democrats who view the Democratic Party unfavorably (net +81; 90 percent favorable – 9 percent unfavorable).
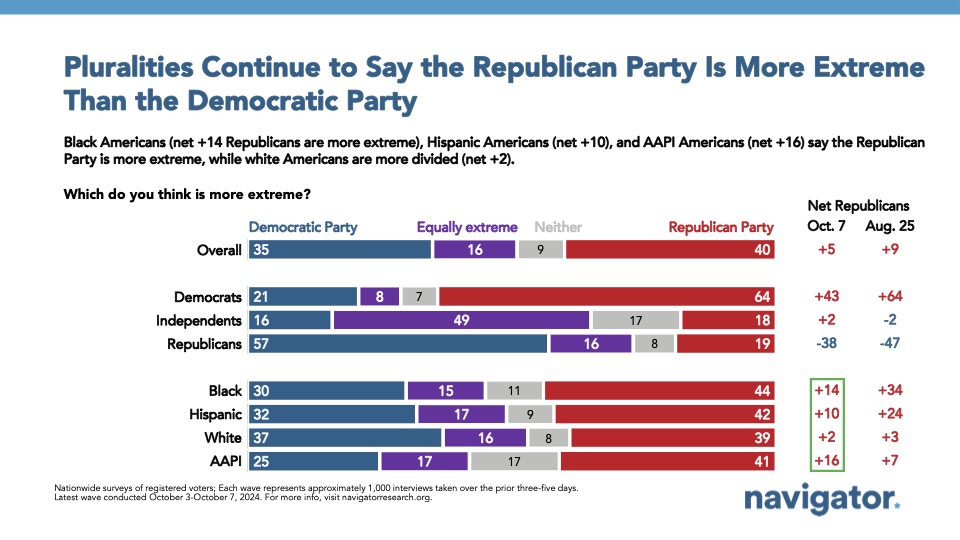
- Americans view the Republican Party as more extreme (40 percent) than the Democratic Party (35 percent), as 16 percent say they are equally extreme and 9 percent say neither party is extreme. About half of independents say the parties are equally extreme (49 percent) while the other half are evenly split between believing the Republican Party is more extreme (18 percent), believing the Democratic Party is more extreme (16 percent), or that neither party is extreme (17 percent).
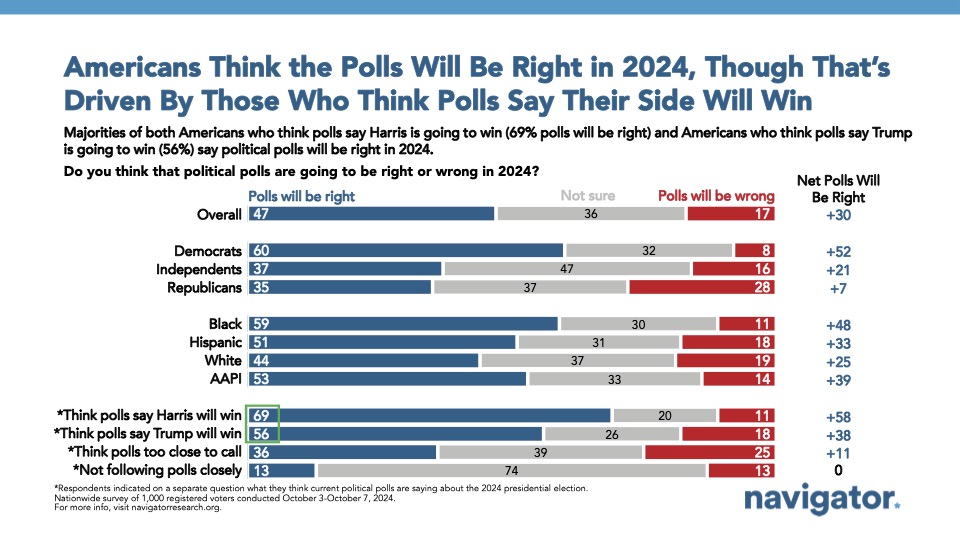
One in three Americans think the polls are too close to predict a winner in the 2024 election.
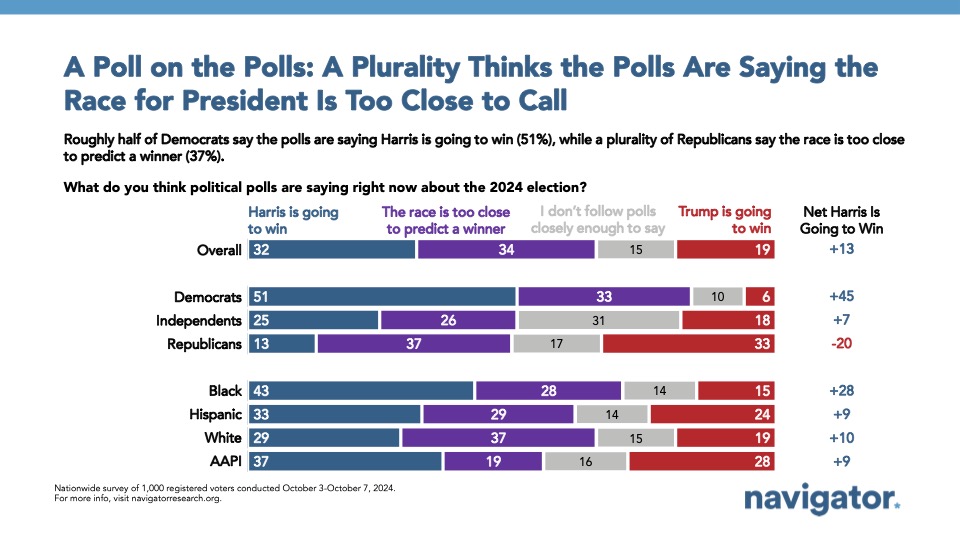
When asked what political polls are currently saying about the 2024 election, 32 percent think they are saying Kamala Harris is going to win, while 19 percent say Donald Trump will win. 49 percent of Americans however either believe the race is too close to predict a winner (34 percent) or that they don’t follow the polls closely enough to say (15 percent). More than one in four independents (26 percent), a third of Democrats (33 percent), and nearly two in five Republicans (37 percent) think the race is too close to call.
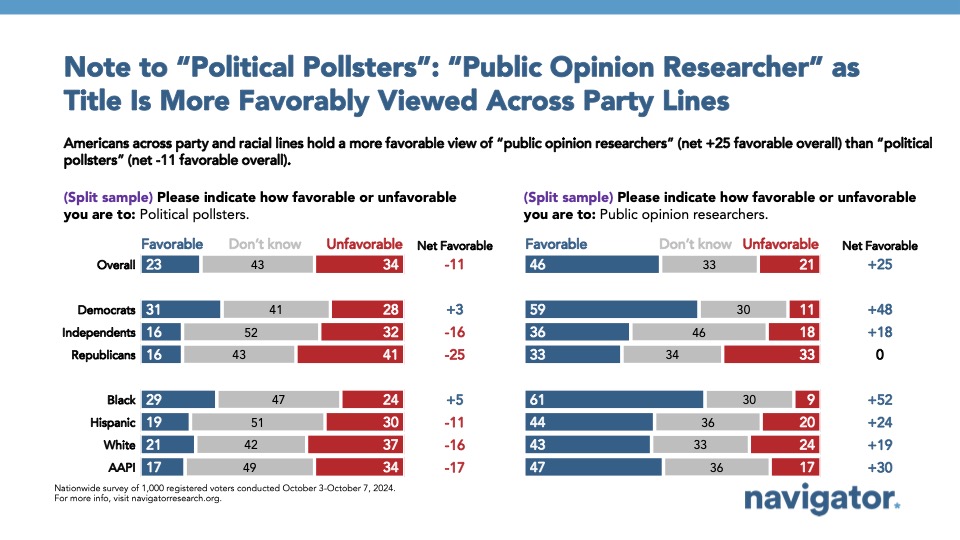
- “Public opinion researchers” are viewed favorably by 25 points (46 percent favorable – 21 percent unfavorable) while “political pollsters” are underwater by 11 points (23 percent favorable – 34 percent unfavorable). Americans are more favorable to “public opinion researchers” than “political pollsters” across party lines, including Democrats (net +48 public opinion researchers; net +3 political pollsters), independents (net +18 public opinion researchers; net -16 political pollsters), and Republicans (net zero public opinion researchers; net -25 political pollsters).
About The Study
Global Strategy Group conducted a public opinion survey among a sample of 1,000 registered voters from October 3-October 7, 2024. 100 additional interviews were conducted among Hispanic voters. 72 additional interviews were conducted among Asian American and Pacific Islander voters. 99 additional interviews were conducted among African American voters. 100 additional interviews were conducted among independent voters. The survey was conducted online, recruiting respondents from an opt-in online panel vendor. Respondents were verified against a voter file and special care was taken to ensure the demographic composition of our sample matched that of the national registered voter population across a variety of demographic variables. The margin of error for the full sample at the 95 percent level of confidence is +/- 3.1 percentage points. The margin of error for subgroups varies and is higher.
