Poll: Top Issues & 2024 Election
This Navigator Research report contains polling data on the latest perceptions of the political landscape, including favorability of both Donald Trump and Kamala Harris, what Americans are hearing about the two candidates, and who Americans trust most to handle the most important issues facing the country.
Americans are split on who they believe will win the 2024 election.
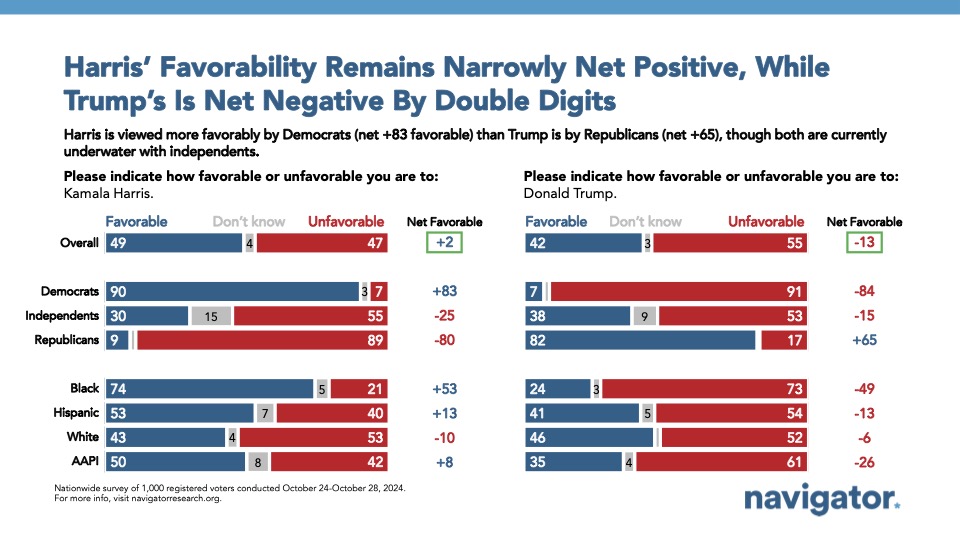
Going into Election Day, Kamala Harris continues to hold a net positive favorability rating while Donald Trump’s favorability is underwater by double digits. About half of Americans view Kamala Harris favorably (net +2; 49 percent favorable – 47 percent unfavorable) while a majority of Americans view Donald Trump unfavorably by a 13-point margin (42 percent favorable – 55 percent unfavorable). While favorability for both major party candidates is highly partisan (90 percent of Democrats having positive views of Harris; 82 percent of Republicans having positive views of Trump), one in three Americans who identify as non-MAGA Republicans view Donald Trump unfavorably (net +36; 67 percent favorable – 31 percent unfavorable). Donald Trump’s favorability is underwater among women by 18 points (40 percent favorable – 58 percent unfavorable), but view Kamala Harris favorably by 8 points (51 percent favorable – 43 percent unfavorable).
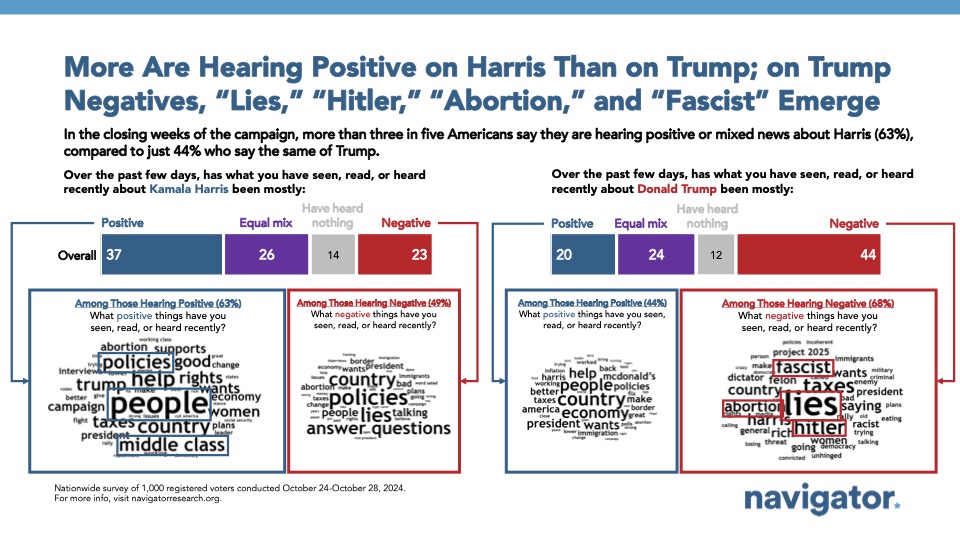
- Two in three Americans are hearing at least some positive news about Kamala Harris (63 percent) compared to just half who are hearing at least some negative news about her (49 percent). For Trump, it is the inverse: 68 percent are hearing at least some negative news about him compared to just 44 percent who are hearing at least some positive.
- When describing the negative news they are hearing about Donald Trump, many cite “lies,” “Hitler,” and “fascism.” When describing the negative news about Kamala Harris, “policies” and “lies” are most cited.
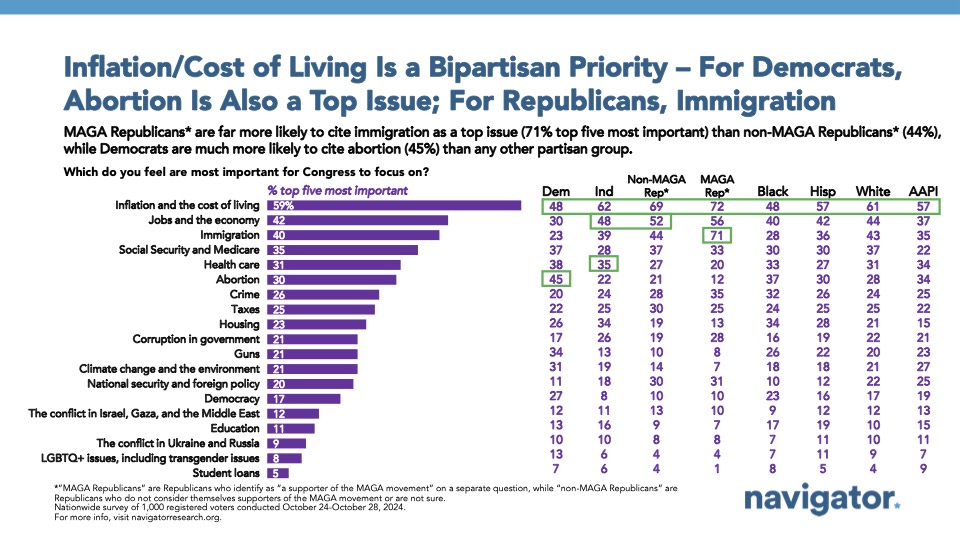
Across partisanship, Americans are most focused on inflation and the cost of living.
A majority of Americans say “inflation and the cost of living” is one of the issues they think Congress should be most focused on (59 percent), including 71 percent of Republicans, 62 percent of independents, and 48 percent of Democrats. The second most important issue to Democrats is abortion (45 percent), while immigration is the next most important issue for Republicans (59 percent). Overall, 90 percent of Americans select at least one economic related issue as a top priority for Congress to focus on.
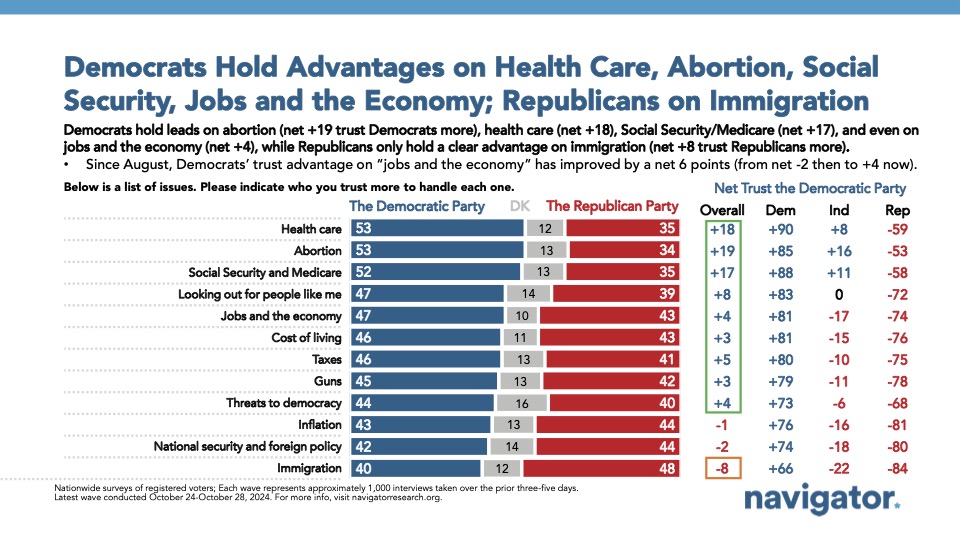
- Trust is split between the Democratic Party and the Republican Party to handle a number of economic issues. The Democratic Party has narrow advantages on handling jobs and the economy generally (net +4; 47 percent trust the Democratic Party more – 43 percent trust the Republican Party more), handling the cost of living (net +3; 46 percent trust the Democratic Party more – 43 percent trust the Republican Party more), and taxes (net +5; 46 percent trust the Democratic Party more – 41 percent trust the Republican Party more), while Americans are evenly split on who they trust to handle inflation (net -1; 43 percent trust the Democratic Party more – 44 percent trust the Republican Party more).
- The Democratic Party holds their greatest advantages on trust in handling abortion (net +19; 53 percent trust the Democratic Party more – 34 percent trust the Republican Party more) and health care (net +18; 53 percent trust the Democratic Party more – 35 percent trust the Republican Party more) while the Republican Party holds their greatest advantage on handling immigration (net -8; 40 percent trust the Democratic Party more – 48 percent trust the Republican Party more).
About The Study
Global Strategy Group conducted a public opinion survey among a sample of 1,000 registered voters from October 24-October 28, 2024. 100 additional interviews were conducted among Hispanic voters. 76 additional interviews were conducted among Asian American and Pacific Islander voters. 100 additional interviews were conducted among African American voters. 100 additional interviews were conducted among independent voters. The survey was conducted online, recruiting respondents from an opt-in online panel vendor. Respondents were verified against a voter file and special care was taken to ensure the demographic composition of our sample matched that of the national registered voter population across a variety of demographic variables. The margin of error for the full sample at the 95 percent level of confidence is +/- 3.1 percentage points. The margin of error for subgroups varies and is higher.
