Poll: Trump’s Actions
This Navigator Research report contains polling data on how Americans view Trump’s first few weeks, including perceptions of his handling of the economy and the change he is bringing to Washington.
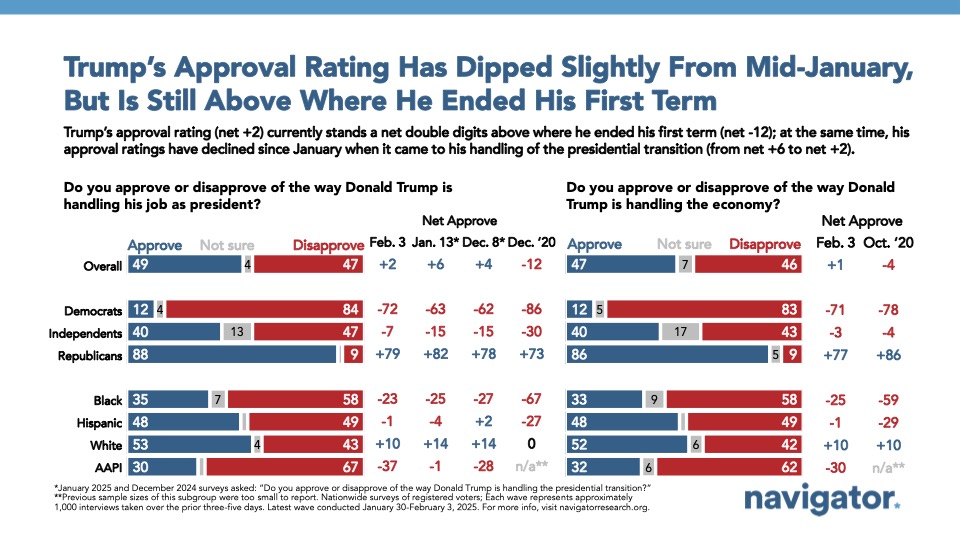
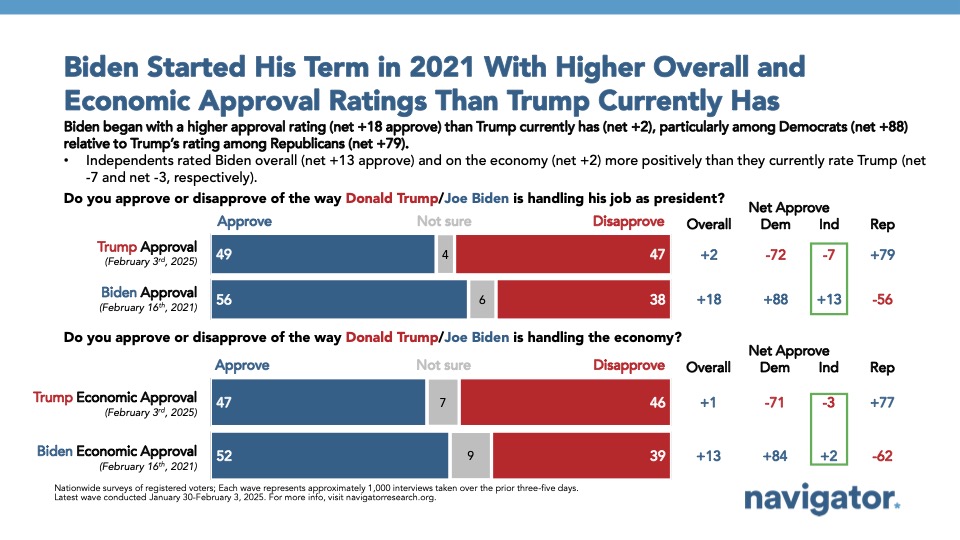
While President Trump’s approval remains above water, his standing is much more fraught than that of President Biden’s in 2021.
Half of Americans approve of Trump’s handling of his job as president (net +2; 49 percent approve – 47 percent disapprove). By comparison, President Biden’s net approval rating was 18 points above water in the weeks after he took office four years ago (56 percent approved – 38 percent disapproved). Americans are also split on whether they approve of Trump’s handling of the economy (47 percent approve – 46 percent disapprove), whereas President Biden was 13 points above water on his handling of the economy in February 2021 (52 percent approved – 39 percent disapproved).
- However, Trump has seen his personal favorability increase since the election: while Trump was underwater by 13 points in October (42 percent favorable – 55 percent unfavorable), his current rating is now only 4 points underwater (net -4; 47 percent favorable – 51 percent unfavorable).
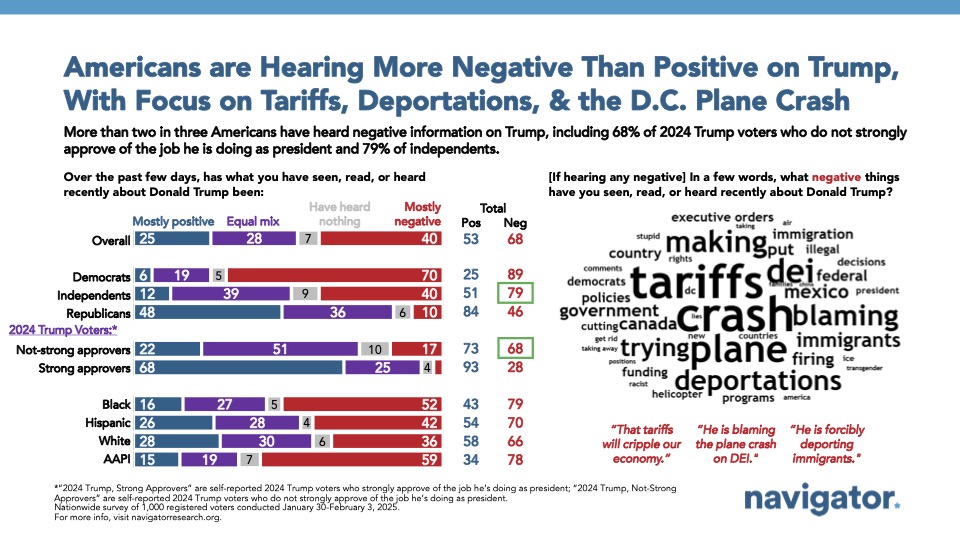
- 84 percent of Americans say they have seen, read, or heard news about Trump over the past few days, including 58 percent who say they have seen “a lot” of news about him. Among the negative news Americans are hearing, they cite “tariffs,” “crash,” and “deportations.”
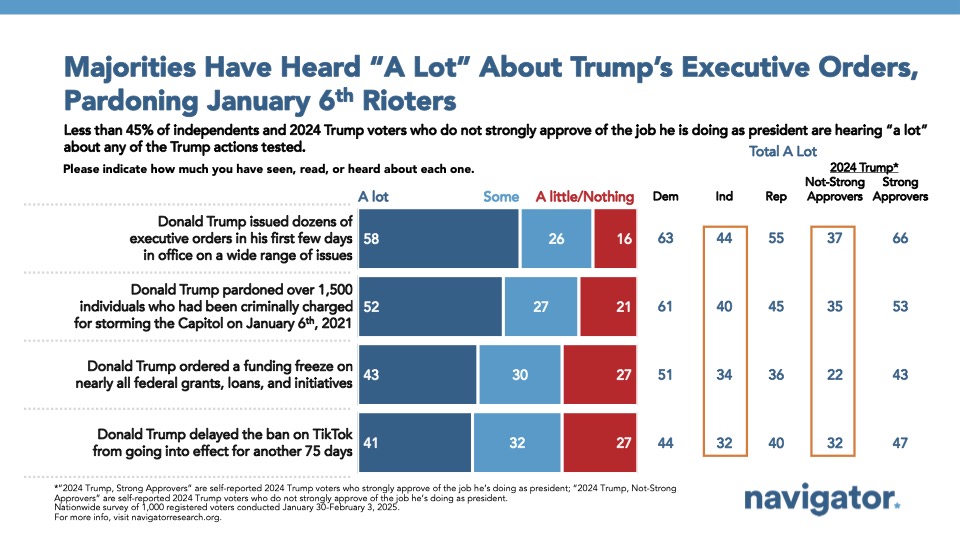
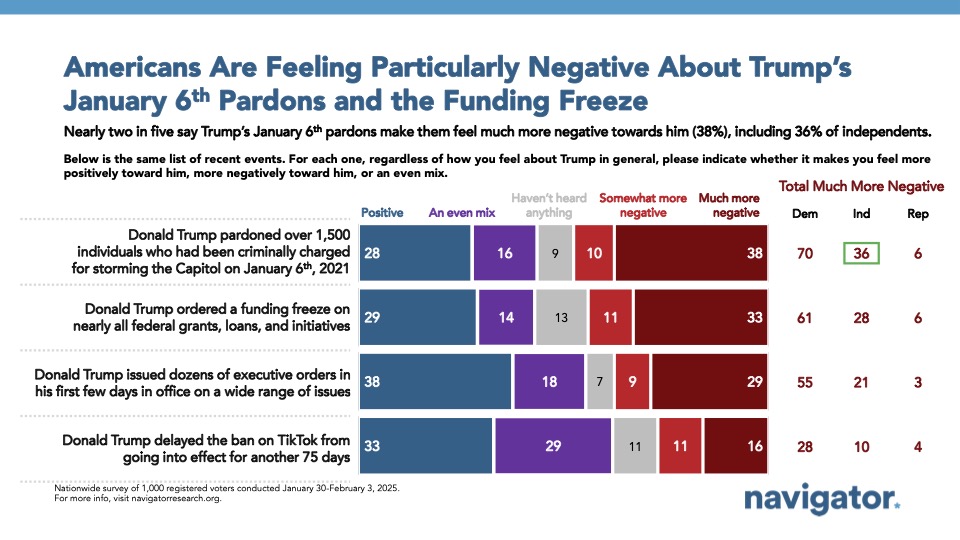
- Four in five Americans say they had seen news about Trump pardoning over 1,500 individuals who had been criminally charged for storming the Capitol on January 6, 2021 (79 percent). By 20 points, more Americans say these pardons negatively impacted how they feel towards the president (net -20; 28 percent positive – 48 percent negative). Similarly, 73 percent of Americans say they had seen news about Trump ordering a funding freeze on nearly all federal grants, loans, and initiatives, and a plurality also feel negatively about how Trump handled it (net -15; 29 percent positive – 44 percent negative). 73 percent say they had seen news about Trump delaying the TikTok ban, and a narrow plurality say this makes them feel positively about Trump (net +3; 33 percent positive – 27 percent negative).
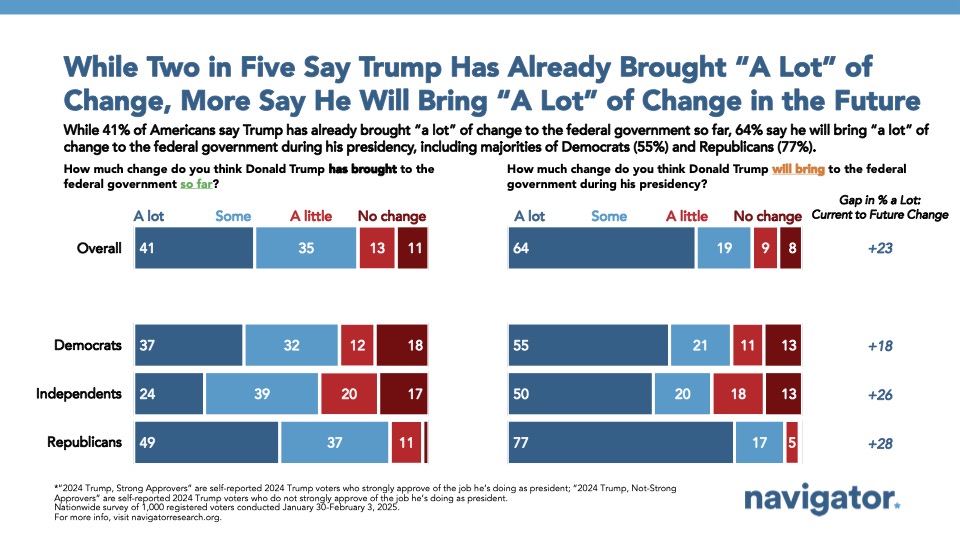
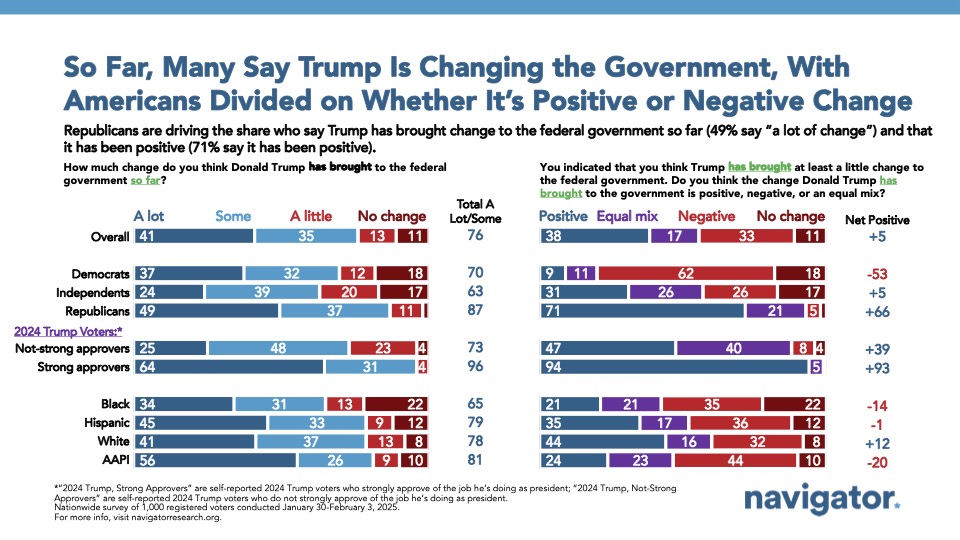
Three in four Americans say that Trump has already brought “a lot” or “some” change to the government.
76 percent of Americans say that Trump has already brought “a lot” or “some” change to the federal government, with two in three expecting him to bring “a lot” of change during his presidency (63 percent). Among those who believe Trump has already brought change to the federal government, a narrow plurality believe the change is positive by 5 points (38 percent positive – 33 percent negative – 17 percent an equal mix), with independents mirroring the country overall (31 percent positive – 26 percent negative – 26 percent an equal mix).
- By 6 points, Americans think Donald Trump wants what is best for himself (53 percent) rather than what is best for the country (47 percent), but split more evenly on whether Trump is bringing more corruption to Washington (51 percent) or fixing corruption (49 percent). Independents are 8 points more likely to believe that Trump is both doing what is best for himself (54 percent) and bringing more corruption to Washington (54 percent).
About The Study
Global Strategy Group conducted a public opinion survey among a sample of 1,000 registered voters from January 30-February 3, 2025. 100 additional interviews were conducted among Hispanic voters. 73 additional interviews were conducted among Asian American and Pacific Islander voters. 100 additional interviews were conducted among African American voters. 100 additional interviews were conducted among independent voters. The survey was conducted online, recruiting respondents from an opt-in online panel vendor. Respondents were verified against a voter file and special care was taken to ensure the demographic composition of our sample matched that of the national registered voter population across a variety of demographic variables. The margin of error for the full sample at the 95 percent level of confidence is +/- 3.1 percentage points. The margin of error for subgroups varies and is higher.

