Poll: Kamala Harris
This Navigator Research report contains polling data on the latest perceptions of Kamala Harris, including her favorability, what Americans view to be her strengths, and how perceptions of her compare to those of Donald Trump.
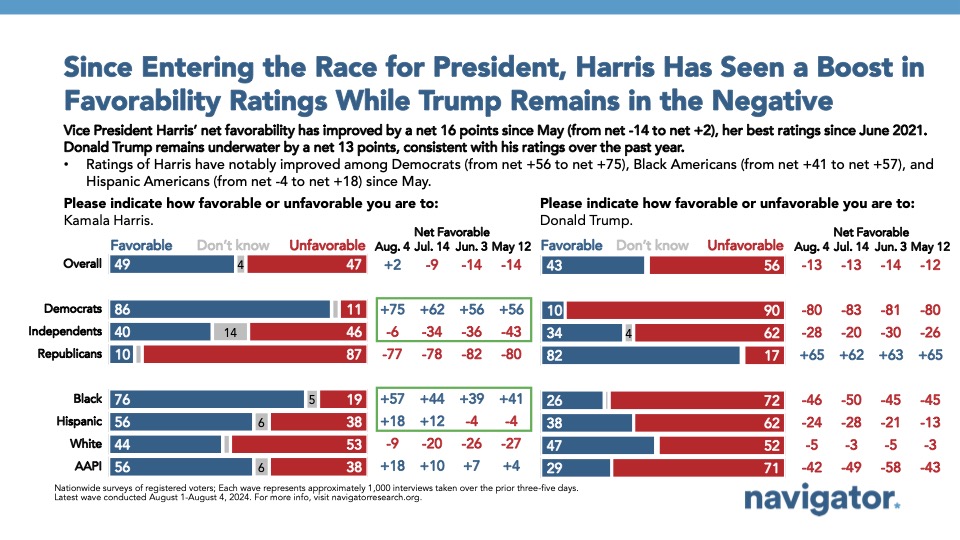
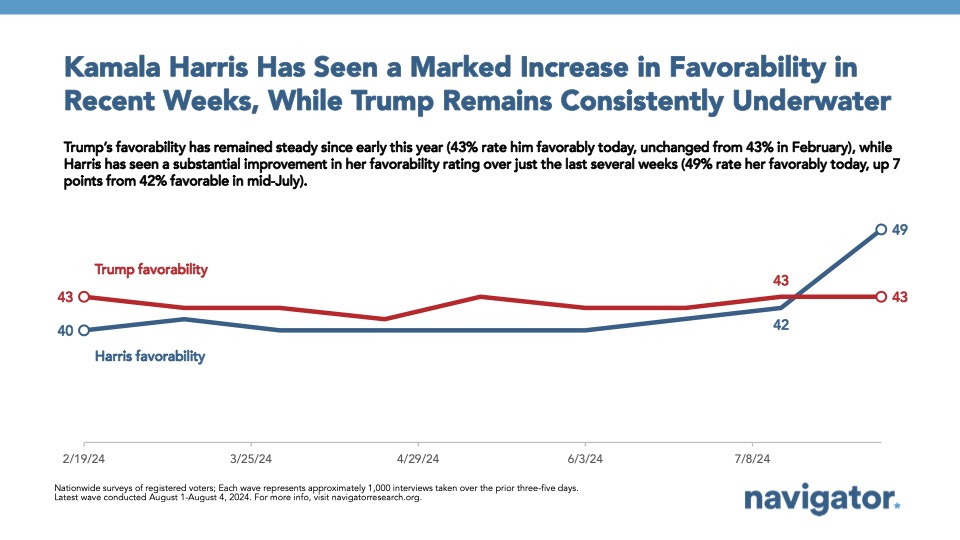
Half of Americans view Vice President Kamala Harris favorably, with her favorability increasing 9 points since June.
About half of Americans now view Kamala Harris favorably (net +2; 49 percent favorable – 47 percent unfavorable), compared to Navigator’s June survey, where Vice President Harris’s favorability was 14 points underwater (40 percent favorable – 54 percent unfavorable). Since June, Harris’s net favorability has increased by 30 points among independents (from net -36 in June to net -6 in August) and by 19 points among Democrats (from net +56 in June to net +75 in August). Republicans have remained overwhelmingly unfavorable toward Harris, though her net favorability has improved by a net 5 points since June (from net -82 in June to net -77 now).
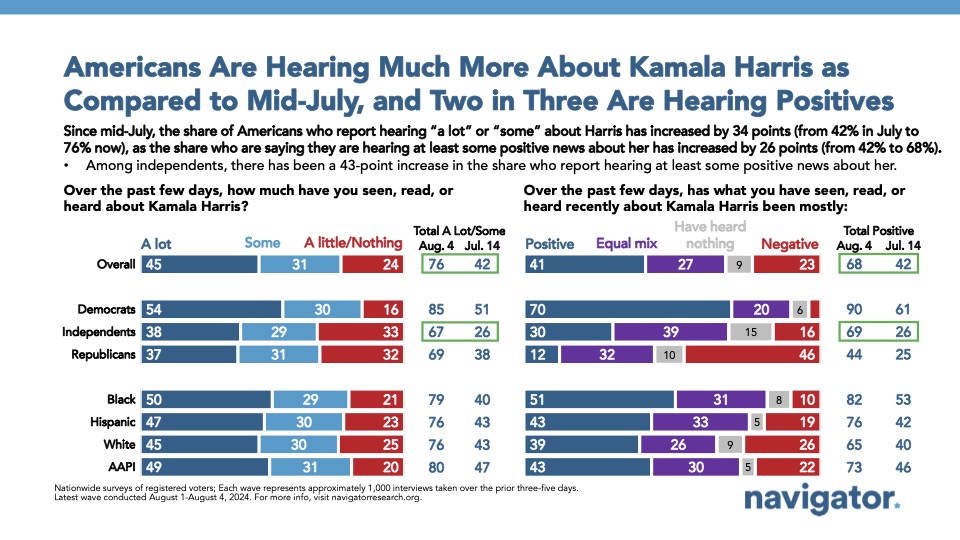
- More than two in three Americans are hearing at least some positive news about Harris (68 percent, with 41 percent saying they are hearing mostly positive news) compared to just half of Americans who are hearing at least some negative news (50 percent, with 23 percent saying they are hearing mostly negative news).
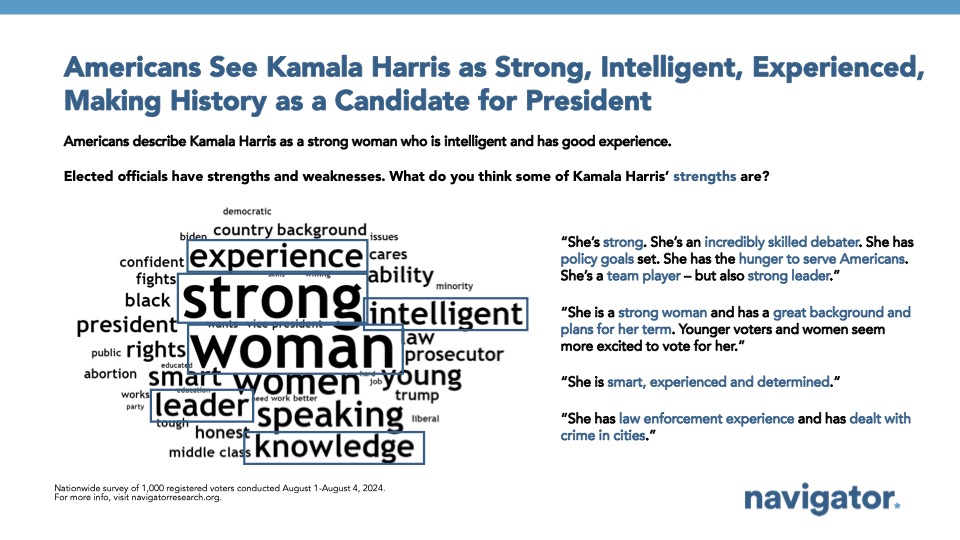
- The most common phrase Americans used when describing Kamala Harris’s strengths referred to her being strong, experienced, intelligent, and making history as a female nominee. The most dominant negative news about Harris focused on her run for president and her work on border and immigration issues.
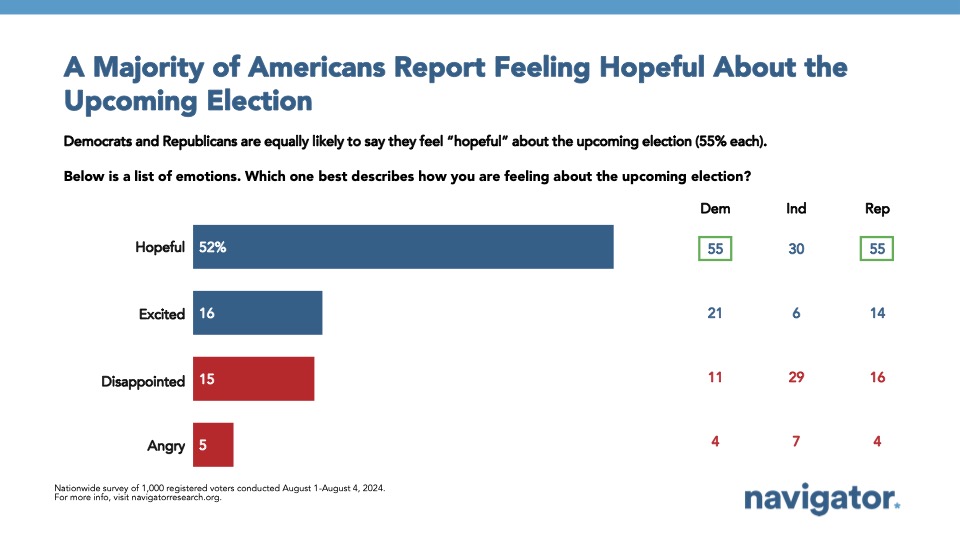
A majority of Americans now feel hopeful about the upcoming election.
52 percent describe their feelings surrounding the upcoming election as “hopeful,” including 55 percent of Democrats, 55 percent of Republicans, and 30 percent of independents. One in five Democrats say they are feeling “excited” about the upcoming election (21 percent), while only 14 percent of Republicans and 6 percent of independents say the same. Among Republicans and independents, “disappointed” distantly follows “hopeful,” with 29 percent of independents, 16 percent of Republicans, and 11 percent of Democrats saying this best describes how they are feeling about the upcoming election.
- In late June and early July, before the assassination attempt of Donald Trump and President Biden’s departure from the presidential race, Navigator fielded a survey among Americans under the age of 35. In this younger American survey, only 34 percent expressed feeling hopeful about the upcoming election, while 27 percent expressed feeling disappointed. This current survey shows a 14 point increase in Americans under the age of 35 feeling hopeful about the upcoming election (48 percent), and a 6 point decrease in those feeling disappointed (21 percent).
Americans are more likely to say Harris is a good role model.
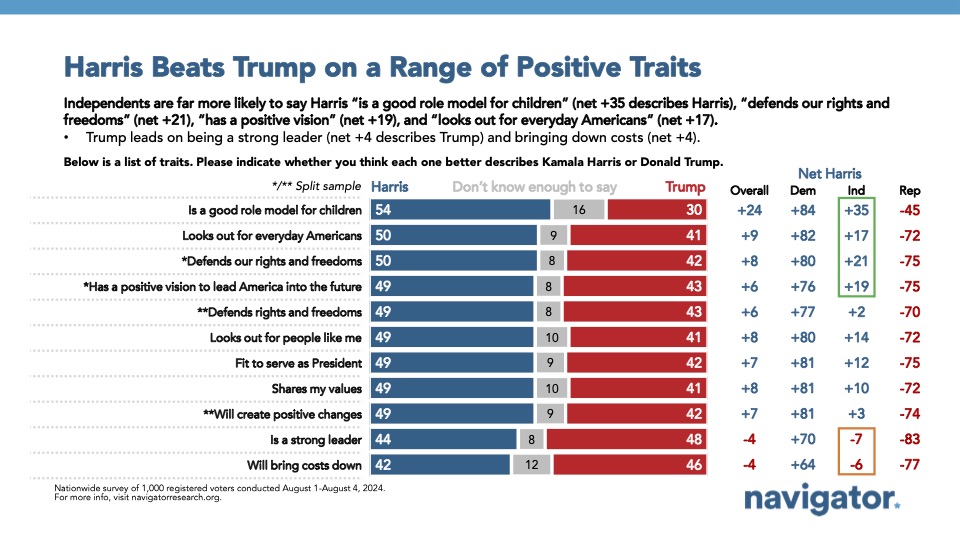
Compared to former President Trump, Harris is seen as a better role model for children, more likely to look out for everyday Americans, and better fit to serve as president. By a 24-point margin, Americans believe “is a good role model for children” better describes Kamala Harris than Donald Trump (54 percent better describes Harris – 30 percent better describes Trump) and by a 9-point margin, “looks out for everyday Americans” is seen as better describing Kamala Harris (50 percent better describes Harris – 41 percent better describes Trump). By contrast, Trump holds narrow 4-point advantages on dimensions like “will bring down costs” (46 percent better describes Trump – 42 percent better describes Harris) and “is a strong leader” (48 percent better describes Trump – 44 percent better describes Harris).
- By a 7-point margin, Americans believe “fit to serve as President” better describes Kamala Harris (49 percent describes Kamala Harris – 42 percent describes Donald Trump).
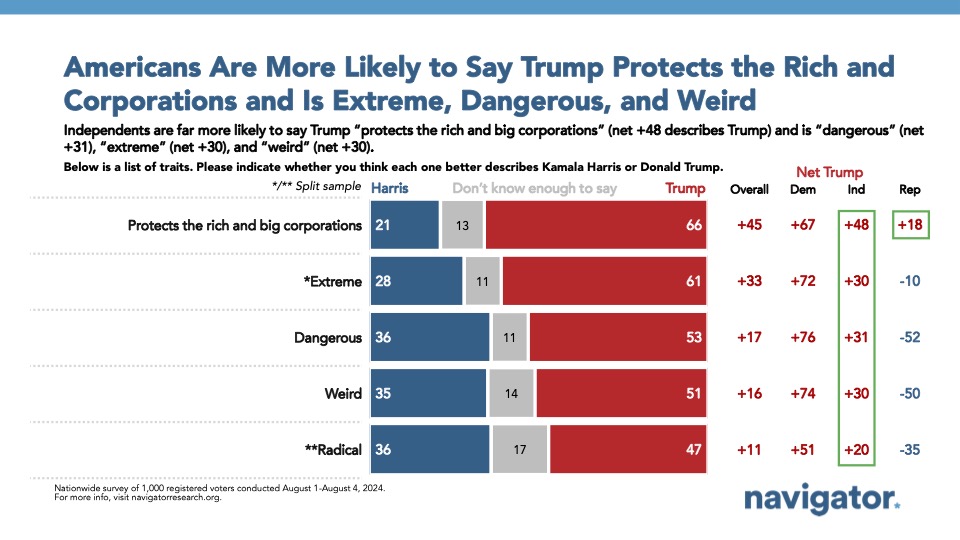
- A majority of Americans believe “extreme” (61 percent better describes Trump – 28 percent better describes Harris), “dangerous” (53 percent better describes Trump – 36 percent better describes Harris), and “weird” (51 percent better describes Trump – 35 percent better describes Harris) are all better descriptors of Trump than Harris.
- Americans are evenly split when it comes to which party they trust more to handle the economy (45 percent trust the Republican Party more – 44 percent trust the Democratic Party more).
Three in four believe Kamala Harris wants abortion to be legal, while a similar majority believes Trump wants abortion to be illegal.
75 percent of Americans believe Harris wants abortion to be legal in all or most cases, while 72 percent believe Donald Trump wants abortion to be illegal in all or most cases. By a 23-point margin, a majority of Americans say they trust Democratic Party more to handle the issue of abortion than trust the Republican Party (55 percent trust the Democratic Party more – 32 percent trust the Republican Party more), including 89 percent of Democrats, independents by a 25 point margin (46 percent trust the Democratic Party more – 21 percent trust the Republican Party more), and even one in five Republicans (21 percent trust the Democratic Party more).
- Among those who believe Donald Trump wants abortion to be illegal in all or most cases are 80 percent of Democrats, 67 percent of Republicans, and 60 percent of independents.
- By an 8-point margin, Americans believe “protects our rights and freedoms” better describes Kamala Harris than Donald Trump (50 percent better describes Kamala Harris – 42 percent better describes Donald Trump).
About The Study
Global Strategy Group conducted a public opinion survey among a sample of 1,000 registered voters from August 1-August 4, 2024. 100 additional interviews were conducted among Hispanic voters. 75 additional interviews were conducted among Asian American and Pacific Islander voters. 100 additional interviews were conducted among African American voters. 100 additional interviews were conducted among independent voters. 200 additional interviews were conducted among voters ages 18-34. The survey was conducted online,
recruiting respondents from an opt-in online panel vendor. Respondents were verified against a voter file and special care was taken to ensure the demographic composition of our sample matched that of the national registered voter population across a variety of demographic variables. The margin of error for the full sample at the 95 percent level of confidence is +/- 3.1 percentage points. The margin for error for subgroups varies and is higher.
