Poll: Trump Approval
This Navigator Research report covers Americans’ perceptions of the Trump administration and Democrats and Republicans in Congress.
Trump’s Approval and Congressional Favorability
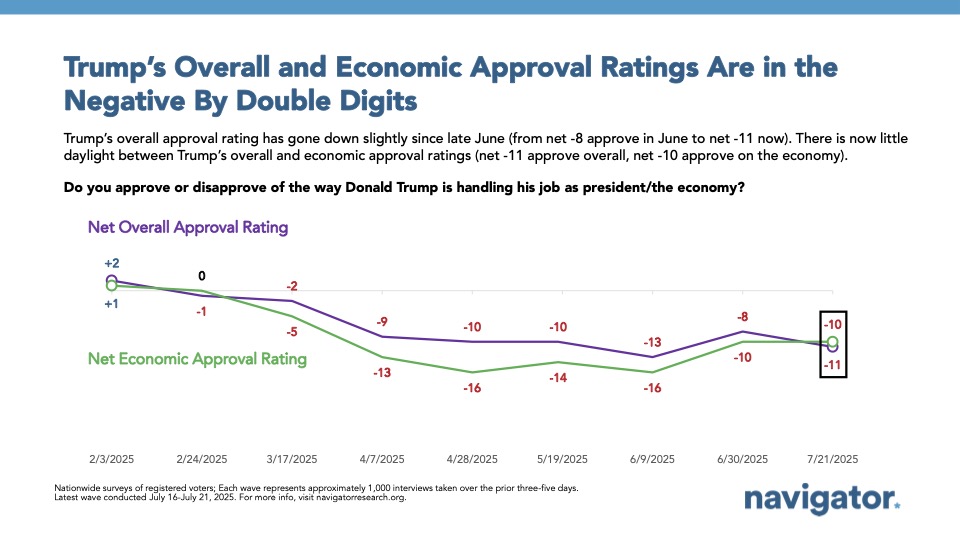
A majority of Americans disapprove of President Trump’s overall handling of the presidency (43 percent approve – 54 percent disapprove), including majorities of Democrats (92 percent disapprove) and independents (60 percent disapprove). Women are more disapproving of Trump’s job (net -22) than men (net even), but both have shifted more negatively: men have shifted from approving of Trump by 10 points to being equally divided on approval, while men under the age of 55 have shifted from approving of Trump by 12 points to disapproving by 8 points. Non-college educated men have gone from approving of Trump by 17 points to just 3 points.
Similarly, Trump’s economic approval remains 10 points underwater (43 percent approve – 53 percent disapprove). Trump’s economic approval is largely divided by gender. Among women, Trump’s economic approval is underwater by 23 points (36 percent approve – 59 percent disapprove), while his handling of the economy is rated positively by men (51 percent approve – 46 percent disapprove).
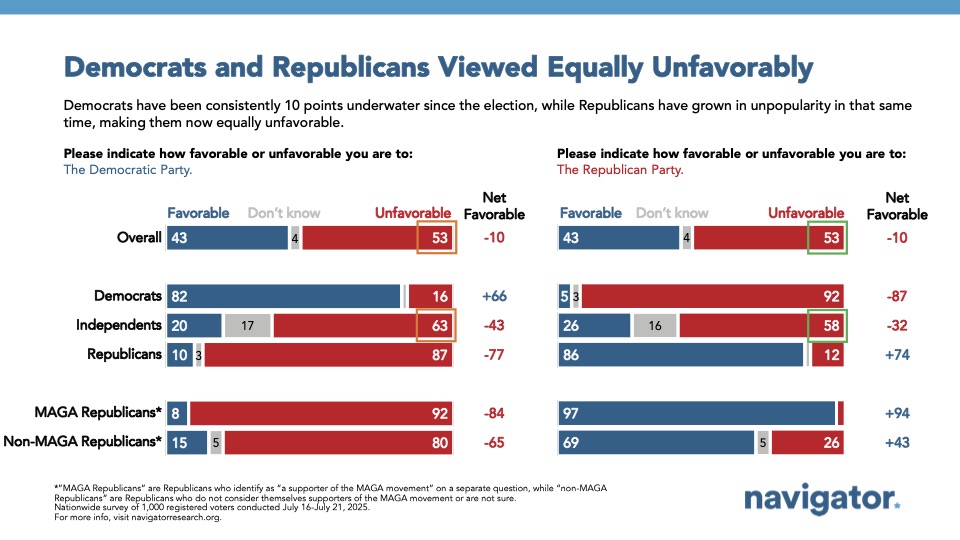
Both Congressional Democrats and Republicans are viewed unfavorably by 10-point margins (43 percent favorable – 53 percent unfavorable). Gen Z Americans view both parties in Congress unfavorably, but are more unfavorable towards Republicans (35 percent favorable – 59 percent unfavorable) than Democrats (43 percent favorable – 51 percent unfavorable).
The Bad News is Breaking Through
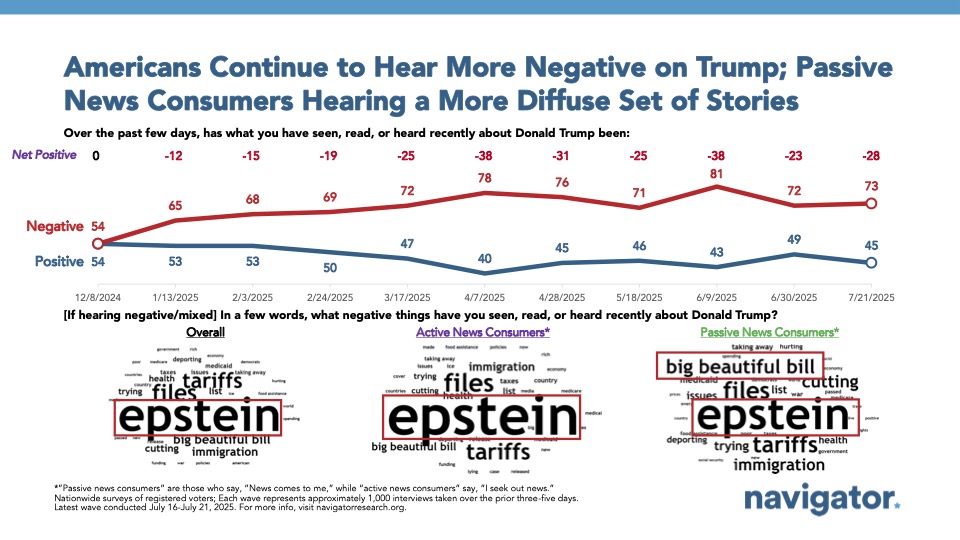
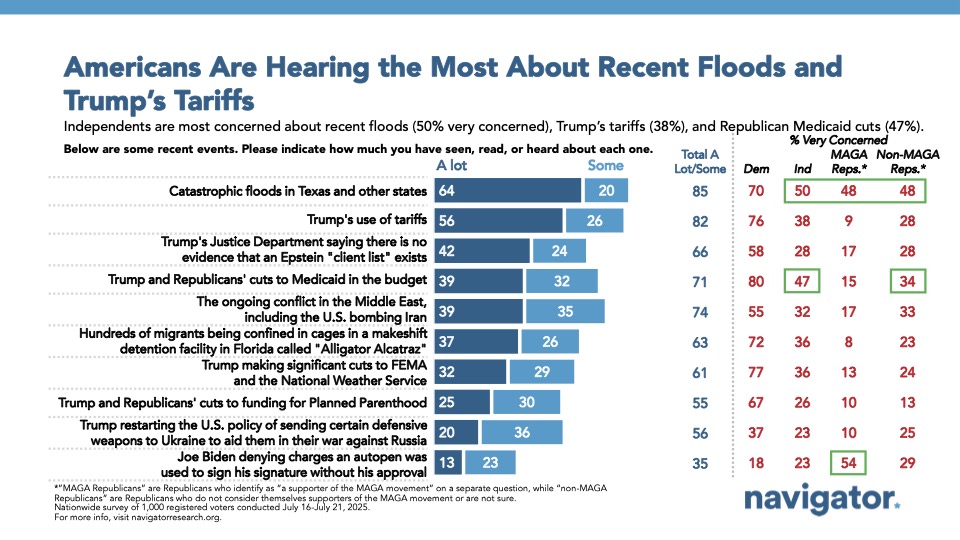
Three-quarters of Americans report hearing “a lot” or “some” news about President Trump over the past few days, with a plurality reporting hearing mostly negative news (48 percent mostly negative). News about the Epstein files dominates the negative news Americans are hearing about Trump, while immigration, the Republican budget bill, and the economy are cited as positive news Americans are hearing.
The catastrophic floods in Texas dominate the current events Americans are hearing the most about (64 percent hearing a lot), followed by Trump’s use of tariffs (56 percent hearing a lot). Other news stories breaking through include the ongoing conflict in the Middle East (39 percent hearing a lot), Trump and Republicans’ cuts to Medicaid (39 percent hearing a lot), and the Justice Department saying there is no Epstein “client list” (42 percent hearing a lot).
From the list of current events, Americans are the most concerned about the flooding in Texas (84 percent concerned), followed by Trump and Republicans’ cuts to Medicaid (69 percent), and Trump making significant cuts to FEMA and the National Weather Service (66 percent).
Trust in Handling the Issues that Matter Most
As President Trump and Congressional Republicans’ cuts to Medicaid are causing widespread concern, Democrats hold a nearly 20-point advantage in trust when it comes to handling Medicaid and a 16-point advantage on handling health care in general.
As concern over the catastrophic flooding in Texas remains prevalent, Americans are divided on who they trust to handle responding to natural disasters. 44 percent trust Democrats in Congress and 41 percent trust Trump and Republicans, though a plurality of independents (37 percent) say they don’t know who they trust.
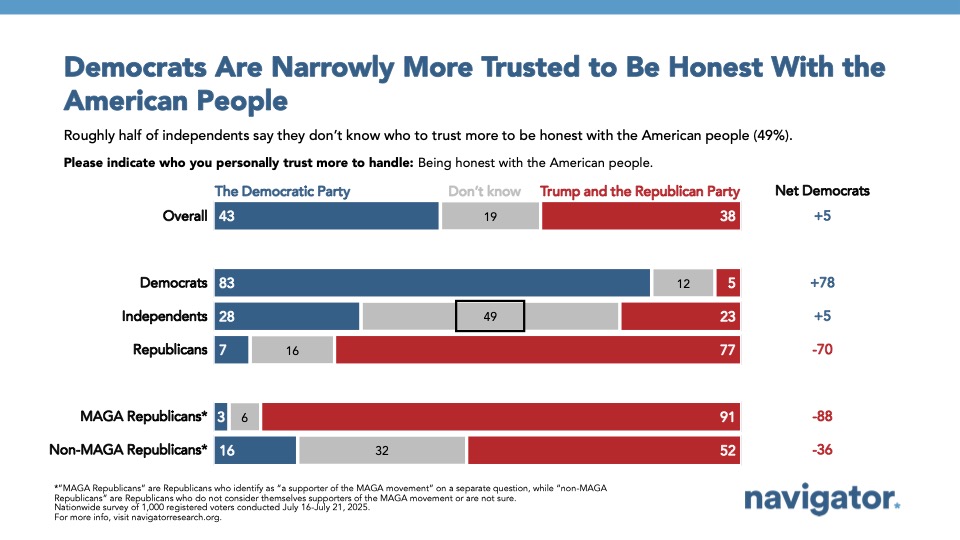
Democrats in Congress hold a narrow advantage on trust in “being honest with the American people” (43 percent trust Democrats – 38 percent trust Trump/Republicans). Trump and Republicans are more trusted to handle immigration (49 percent trust Trump/Republicans – 40 percent trust Democrats) and the conflict in the Middle East (45 percent trust Trump/Republicans – 36 percent trust Democrats).
