Poll: Political Violence in the U.S.
This Navigator Research report contains polling data on the latest perceptions of political violence in the United States, including levels of concern for political violence today and in the future, which party is more trusted to combat political violence, and which party is more prone to using political violence in order to push their political agenda.
Americans are concerned about political violence today and in the future.
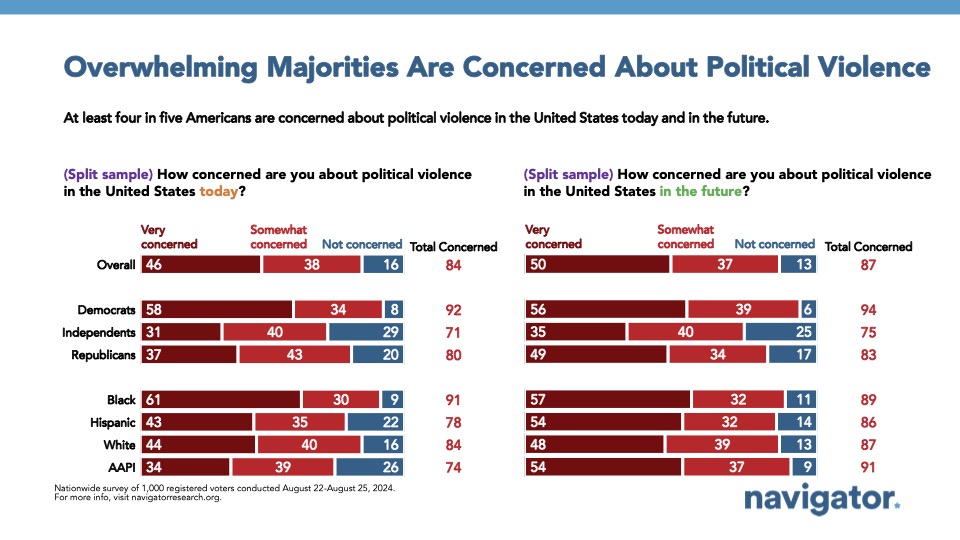
Overwhelming majorities of Americans are concerned about political violence today and in the future in the United States. 84 percent of Americans are concerned about political violence in the United States today, including 46 percent who are “very” concerned. Similarly, 87 percent of Americans are concerned about future political violence, including 50 percent who say they are “very” concerned. Concern over political violence is shared across party lines, with 92 percent of Democrats, 80 percent of Republicans, and 71 percent of independents saying they are concerned about political violence today in the United States.
- The intensity of concern varies across party lines, with 58 percent of Democrats are “very” concerned about political violence, compared to 31 percent of independents and 37 percent of Republicans.
Democrats are more trusted to combat political violence, while Republicans are seen as more prone to using political violence in pushing their political agenda.
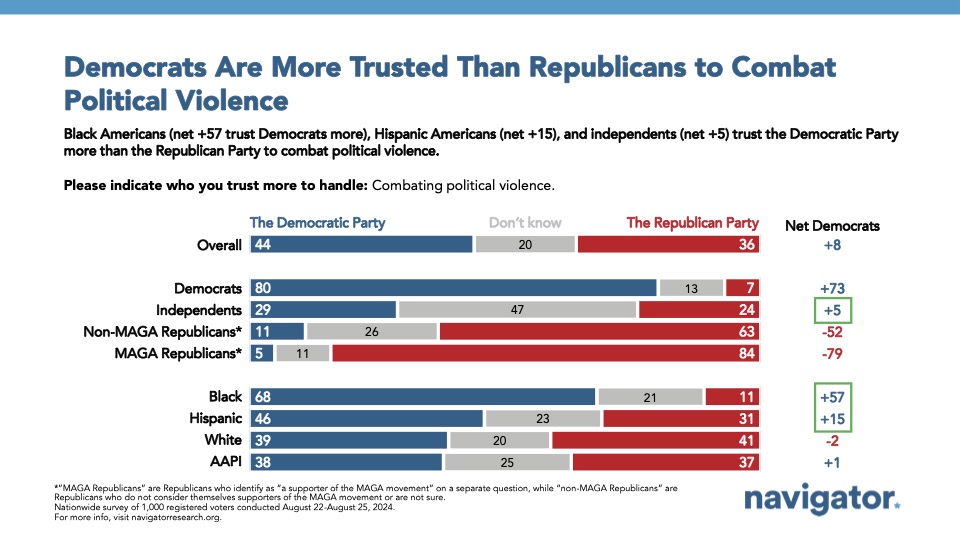
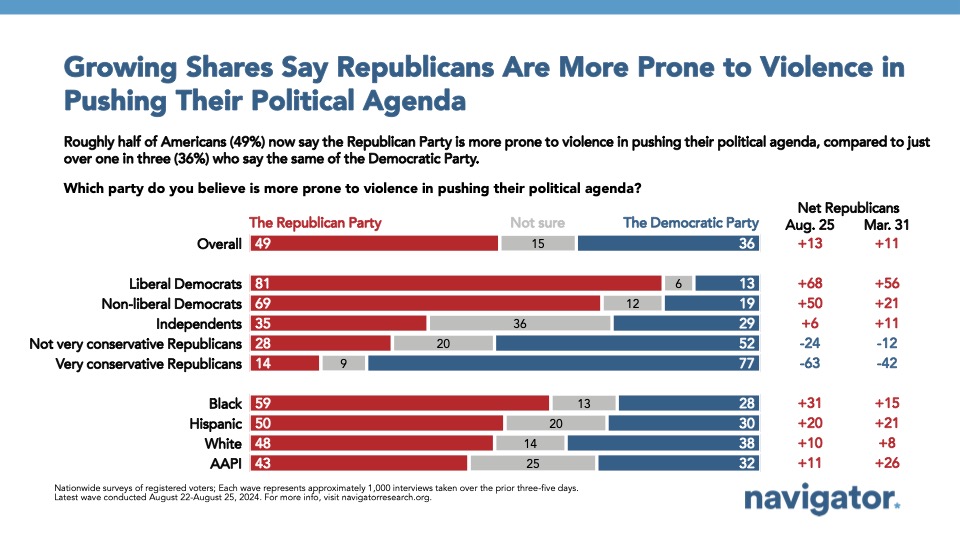
By an 8-point margin, Americans trust the Democratic Party more than the Republican Party to combat political violence (44 percent trust Democrats – 36 percent trust Republicans). While Americans trust the Democratic Party more to combat political violence, by a 13-point margin they believe the Republican Party is more prone to using political violence in order to push their political agenda (49 percent Republican Party – 36 percent Democratic Party).
- Those who believe the Republican Party is more prone to political violence include liberal Democrats (net +68; 81 percent Republican Party – 13 percent Democratic Party), non-liberal Democrats (net +50; 69 percent Republican Party – 19 percent Democratic Party), and independents (net +6; 35 percent Republican Party – 29 percent Democratic Party), while those identifying as not very conservative Republicans (net -24; 28 percent Republican Party – 52 percent Democratic Party) and conservative Republicans (net -63; 14 percent Republican Party – 77 percent Democratic Party) believe the Democratic Party is more prone to using political violence.
- A majority of Black Americans believe the Republican Party is more prone to political violence (net +31; 59 percent Republican Party – 28 percent Democratic Party), as well as a plurality of Hispanic Americans (net +20; 50 percent Republican Party – 30 percent Democratic Party).
Americans are concerned about Trump pushing for new rules that would make it easier for officials to refuse to certify election results.
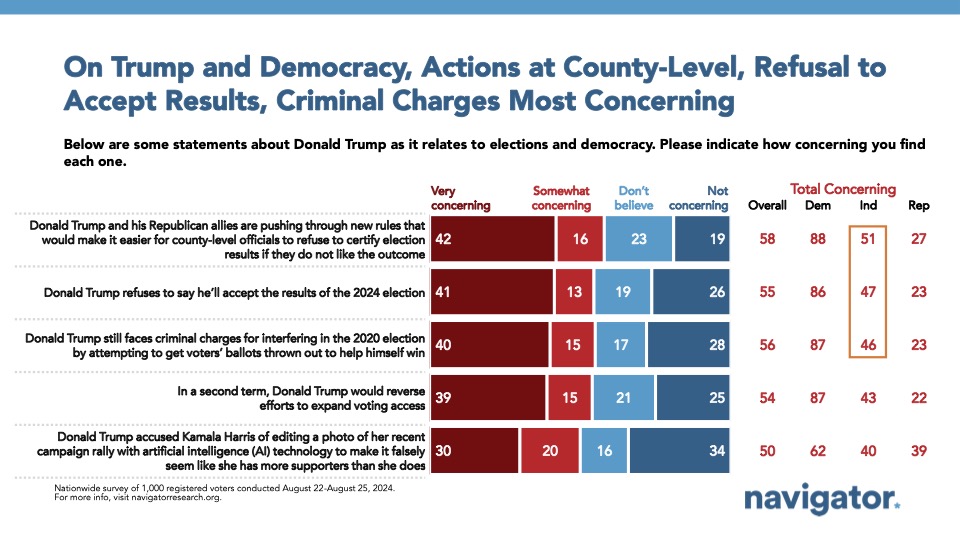
A majority of Americans are concerned by Donald Trump’s actions regarding county-level election certification, his refusal to accept election results, and his criminal charges for interfering in the 2020 election. 58 percent of Americans find it concerning that “Donald Trump and his Republican allies are pushing through new rules that would make it easier for county-level officials to refuse to certify election results if they do not like the outcome,” including 42 percent who find the statement “very” concerning. Similarly, 55 percent of Americans are concerned that “Donald Trump refuses to say he’ll accept the results of the 2024 election,” including 41 percent who find the statement “very” concerning.
56 percent express concern that “Donald Trump still faces criminal charges for interfering in the 2020 election by attempting to get voters’ ballots thrown out to help himself win” including 40 percent who find it “very” concerning.
A majority of Democrats and independents (88 percent and 51 percent, respectively), as well as 27 percent of Republicans are concerned that “Donald Trump and his Republican allies are pushing through new rules that would make it easier for county-level officials to refuse to certify election results if they do not like the outcome.”