Poll: Kamala Harris & the DNC
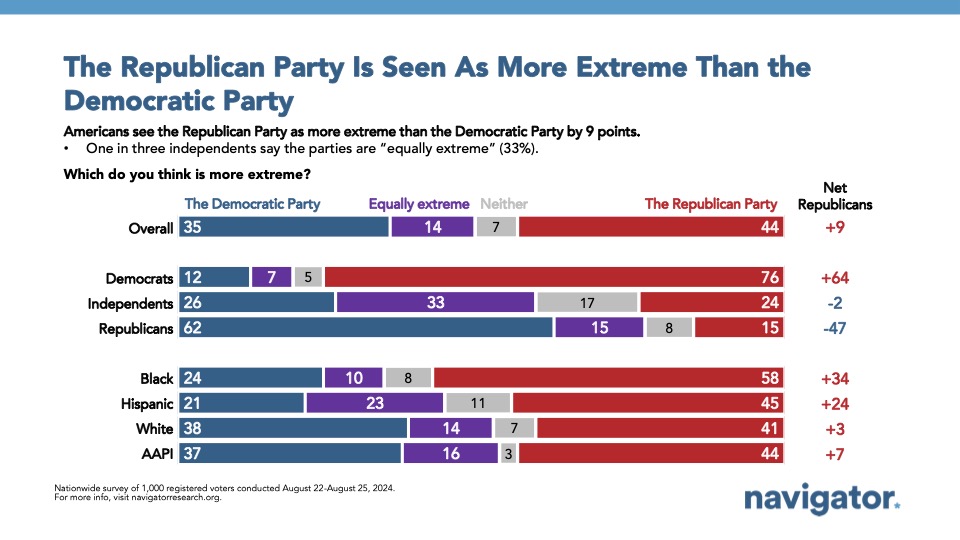
This Navigator Research report contains polling data on regarding Americans’ reactions to the Democratic National Convention last week, including the share of Americans who engaged with it by watching all or part of it live versus engaging with news coverage of it after the fact, and how Americans who engaged with the DNC perceived what they saw, read, or heard about it. This release also looks at perceptions of the political parties, including who they are seen as speaking to and for and whether Americans consider each political party “extreme.”
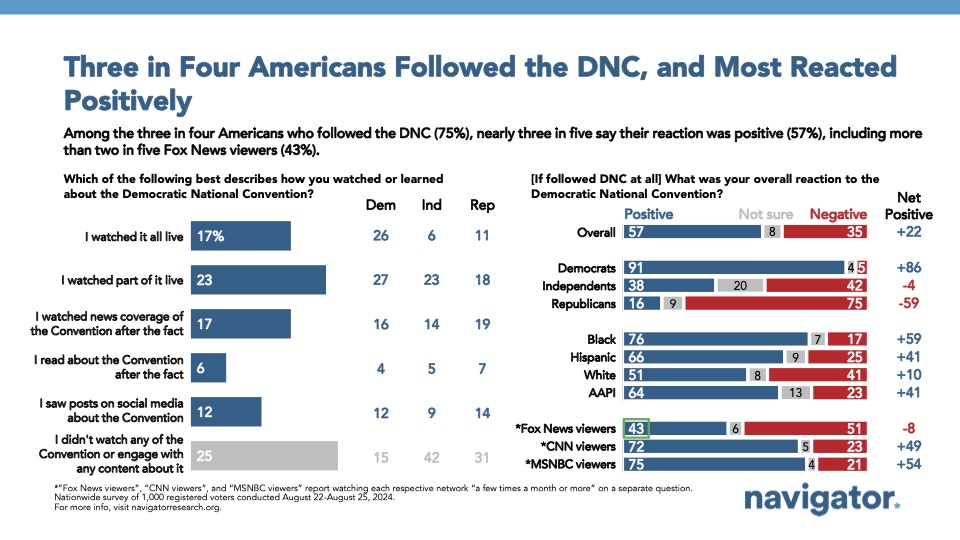
Three in four Americans engaged with coverage of the Democratic National Convention in some way last week.
Two in five Americans reported watching all or part of the DNC live as it happened (40 percent; 17 percent report watching all of it live and 23 percent report watching part of live), while another one in three Americans (33 percent) engaged with the DNC either by watching news coverage of it after the fact (17 percent), reading about it after the fact (6 percent), or by seeing posts on social media (12 percent).
- Those who watched all or part of the Convention live were overwhelmingly more likely to identify as Democrats (60 percent) than either Republicans (30 percent) or independents (10 percent), while those who engaged with the DNC by seeing, hearing, or reading about it were narrowly more likely to be Republicans (47 percent) than Democrats (42 percent). Among the 25 percent who did not engage with the Convention at all, they identified overwhelmingly more as Republicans (50 percent) than either Democrats (27 percent) or independents (23 percent).
- By news consumption, groups that were most likely to watch all or part of the DNC live include MSNBC viewers (62 percent), CNN viewers (59 percent), those who watch local TV (52 percent), and those who report using Twitter on a daily basis (50 percent).
Among those who engaged with the convention, nearly three in five had a positive reaction to what they read, saw, or heard.
By a 22-point margin, those engaging with coverage of the convention had a more positive reaction than a negative one (57 percent positive – 35 percent negative). While nine in ten Democrats who engaged with the DNC were positive toward it (91 percent positive – 5 percent negative), independents were evenly split on their reaction (38 percent positive – 42 percent negative, with an additional 20 percent who said they weren’t sure). A number of demographic subgroups had significantly more positive reactions to the Convention, including 76 percent of Black Americans (76 percent), college-educated women (70 percent), and Hispanic Americans (66 percent).
- Among those who disapprove of both President Biden and former President Trump, a narrow plurality had a more positive reaction to the DNC than negative (net +8; 47 percent positive – 39 percent negative).
- While Republicans who identify as being part of the MAGA movement were overwhelmingly negative in their reaction to the Convention (net -74; 9 percent positive – 83 percent negative), a quarter of Republicans who do not identify with the MAGA movement were positive about coverage of the DNC (net -39; 26 percent positive – 65 percent negative).
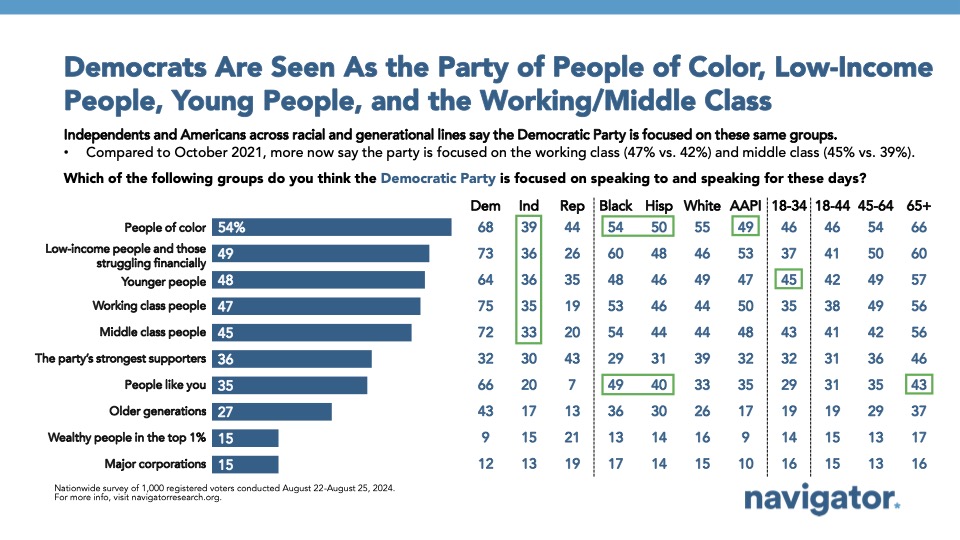
Nearly half of Americans believe the Democratic Party speaks to and for middle class and working people.
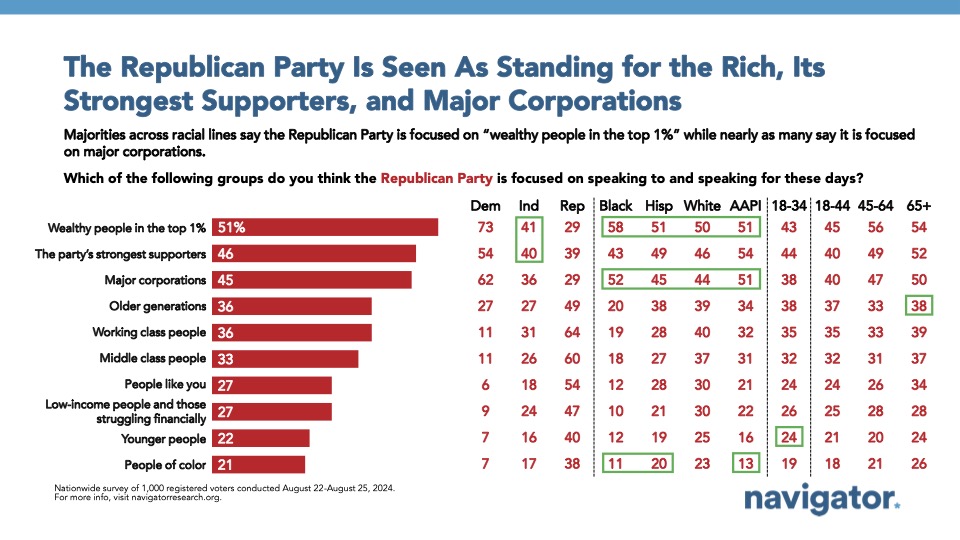
An increasing share of Americans — nearly half — think the Democratic Party is focused on speaking to and speaking for working class and middle class people, only one in three say the same for the Republican Party. 47 percent of Americans think the Democratic Party is speaking to and speaking for working class people, up 8 points since October 2021; 45 percent say the same about the Democratic Party speaking to and speaking for middle class people, also an 8-point increase in that time. By contrast, only 36 percent say the same about the Republican Party being focused on speaking to and speaking for working class people and 33 percent say the same about middle class people.
- A majority of Americans say that the Democratic Party is focused on speaking to and speaking for people of color (54 percent), while a majority of Americans think the Republican Party is focused on speaking to and speaking for wealthy people in the top one percent (51 percent).
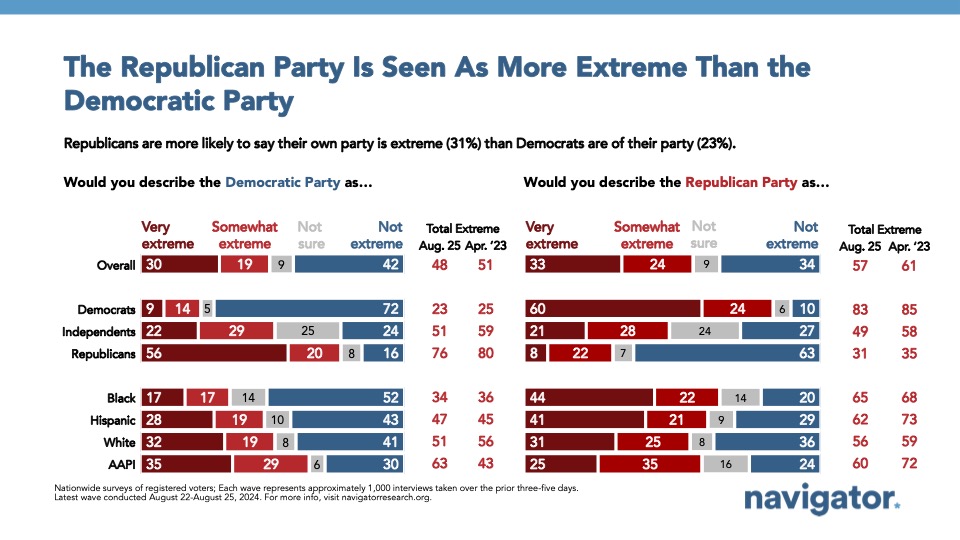
Americans are significantly more likely to view the Republican Party as extreme than the Democratic Party.
Nearly three in five Americans describe the Republican Party as extreme (net +23; 57 percent extreme – 34 percent not extreme), including more than four in five Democrats (net +72; 83 percent extreme – 10 percent not extreme) and independents by 22 points (49 percent extreme – 27 percent not extreme). Nearly one in three Republicans also agree the Republican Party is extreme (net -32; 31 percent extreme – 63 percent not extreme), with a near split among Republicans who do not identify with the MAGA movement (net -5; 44 percent extreme – 49 percent not extreme).
- By comparison, a narrow plurality view the Democratic Party as extreme (net +6; 48 percent extreme – 42 percent not extreme), with a nearly similar share of independents who believe the Democratic Party is as extreme as the Republican Party (net +27; 51 percent extreme – 24 percent not extreme).

