Poll: Taxes
This Navigator Research report covers attitudes toward both the 2017 tax law enacted during President Trump’s first term and Trump and Republicans’ new tax plans for this year.
Pluralities of Americans are opposed to both the 2017 tax law enacted during President Trump’s first term and to Trump and Republicans’ new tax plan, and opposition increases when given additional information about them.
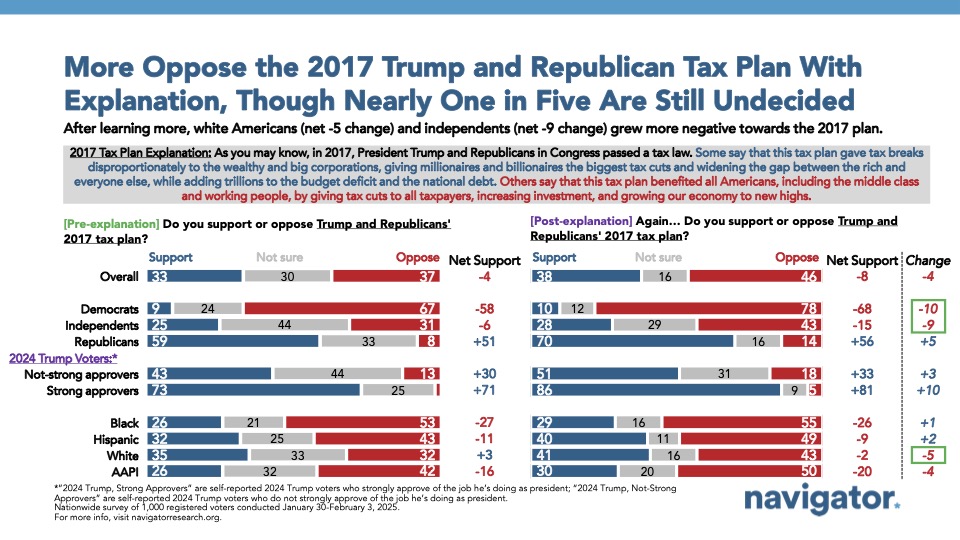
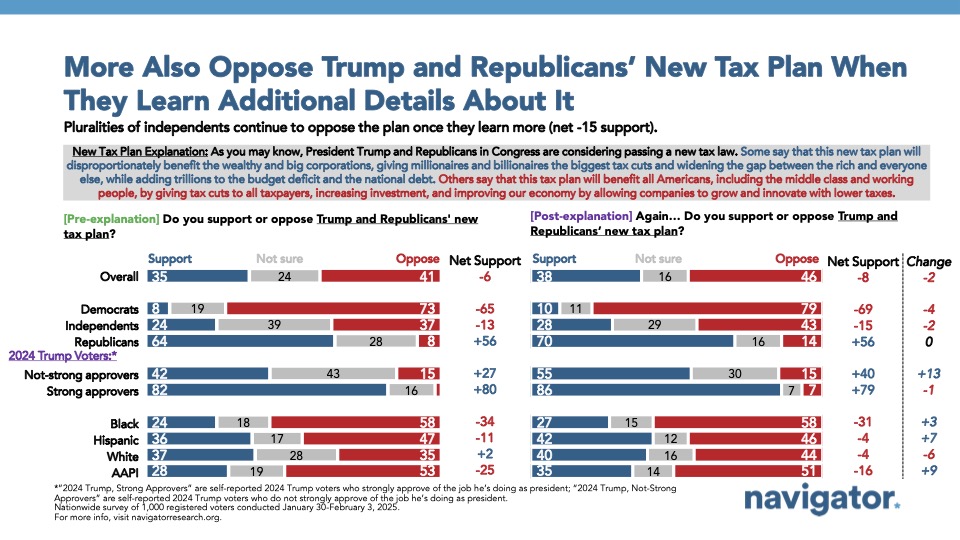
When initially asking about Trump and Republicans’ 2017 tax law without any context, a narrow plurality oppose the law (net -4; 33 percent support – 37 percent oppose) with an additional 30 percent who are not sure. Americans hold similar views on Trump and Republicans’ new tax plan (net -6; 35 percent support – 41 percent oppose, with an additional 24 percent who are not sure). In both cases, a plurality of independents are not sure how they would rate either Trump and Republicans’ 2017 tax law (44 percent) or Trump and Republicans’ new tax plan (39 percent), though both start off with net negative opposition (net -6 for the 2017 tax law; net -13 for Trump and Republicans’ new tax plan).
- After giving balanced information from both opponents who say Trump and Republicans’ 2017 tax plan disproportionately benefited the wealthy and big corporations while adding trillions to the budget deficit and national debt, and supporters who say that it benefited all Americans by giving tax cuts across the board and grew the economy to new highs, net opposition grows from net -4 to net -8 (38 percent support – 46 percent oppose, with 16 percent still unsure). When framing Trump and Republicans’ new tax plan with similar information about what it would do, net opposition increases from net -6 to net -8 (38 percent support – 46 percent oppose, with 16 percent still unsure).
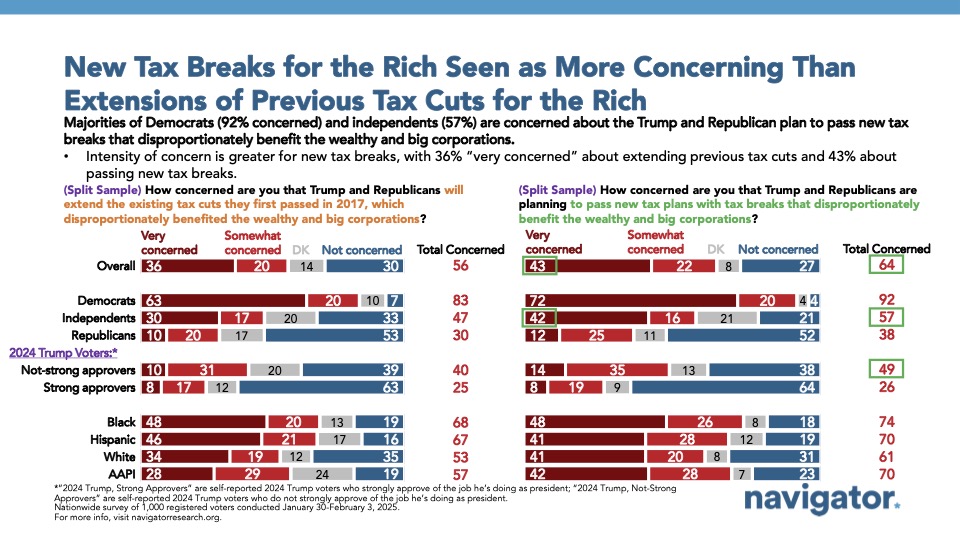
Trump and Republicans “planning to pass new tax plans” that disproportionately benefit the wealthy and big corporations is more concerning than when framed as that they are “extending the existing tax cuts they first passed in 2017.”
64 percent of Americans are concerned Trump and Republicans are “planning new tax plans that disproportionately benefit the wealthy and big corporations,” including nearly three in five independents (57 percent) and about half of 2024 Trump voters who do not strongly approve of the job he’s doing as president (49 percent). While most Americans are also concerned when framed as Trump and Republicans “extend[ing] the existing tax cuts they first passed in 2017” (56 percent), concern is 8 points lower than when framed as “planning to pass new tax plans.”
In a separate battery, more than two in three Americans found a range of messages about Trump and Republicans’ new tax plans to be concerning, including that:
- Trump and Republicans are pushing a new tax plan that will give huge tax breaks to billionaires and wealthy corporations while the middle class foots the bill, as programs like Social Security, Medicare, Medicaid, veterans’ health care, and SNAP (formerly known as food stamps) could be cut to pay for the plan (69 percent find this to be concerning, including 55 percent who find this to be “very” concerning); and,
- Trump and Republicans are pushing a new tax plan that will give huge tax breaks to billionaires and wealthy corporations and make income inequality even worse than it already is. It will allow the rich and big corporations to continue to get richer while the middle class struggles to get by (68 percent find this to be concerning, including 52 percent who find this to be “very” concerning).
Four in five Americans view the Republican Party as looking out most for wealthy Americans, big corporations, billionaires, and CEOs.
84 percent view the Republican Party as looking out for wealthy Americans, with similar shares saying the same about big corporations (84 percent), billionaires (82 percent), and CEOs (82 percent). Narrow majorities believe the Republican Party is not looking out for small businesses (net -6; 47 percent looking out for – 53 percent not looking out for) or working families (net -10; 45 percent looking out for – 55 percent not looking out for), while opinion is evenly split on whether the Republican Party is looking out for the middle class (50 percent looking out for – 50 percent not looking out for).
- By 14 points, 57 percent of Americans agree more that Donald Trump’s policies put the wealthy first compared to just 43 percent who say that Trump’s policies put working and middle class people first. Independents agree more that Trump’s policies are putting the wealthy first by an even larger 22 points (61 percent putting wealthy people first – 39 percent putting working and middle class people first).
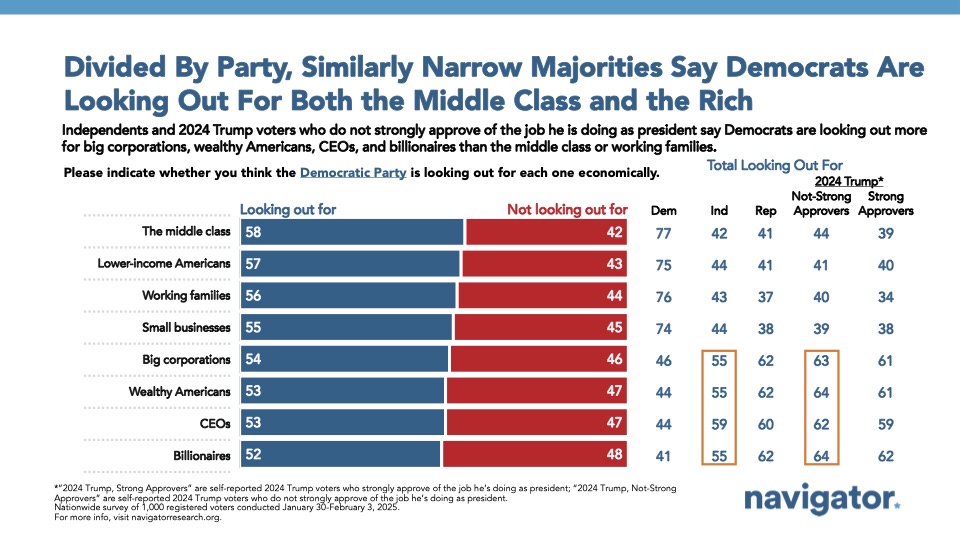
While nearly three in five Americans see the Democratic Party as looking out for the middle class economically, small majorities believe they are also looking out for big corporations and the wealthy.
Majorities view the Democratic Party as looking out for the middle class (58 percent), lower-income Americans (57 percent), working families (56 percent), and small businesses (55 percent). However, majorities also view the Democratic Party as looking out for big corporations (54 percent), wealthy Americans (53 percent), CEOs (53 percent), and billionaires (52 percent).
- The Democratic Party is only viewed as looking out for the middle class by 8 points more than the Republican Party is (58 percent compared to 50 percent); only about two in five independents think each party is looking out for the middle class economically (42 percent say the Democratic Party is compared to 43 percent who say the Republican Party is).


