Poll: Political Landscape
This Navigator Research report covers perceptions of the current political and economic landscape.
Trump Approval and News
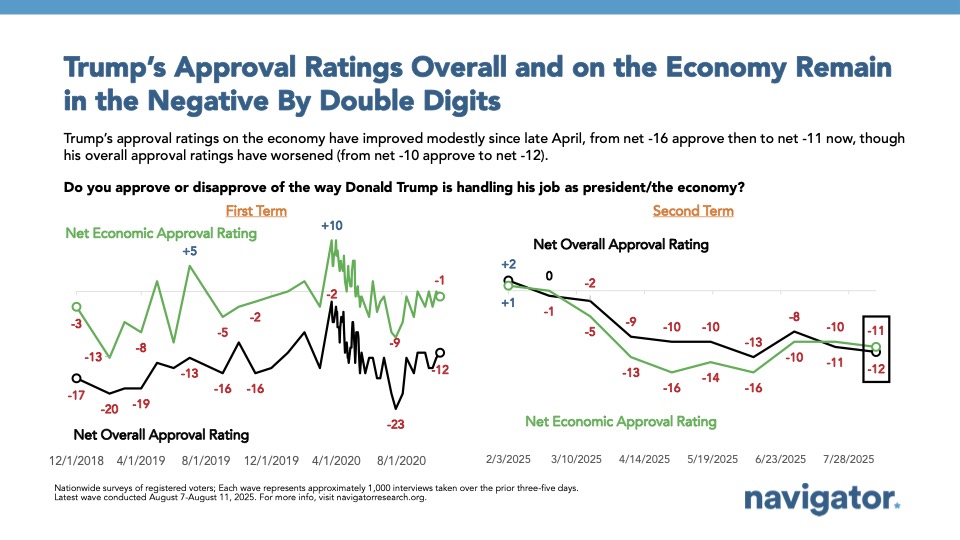
President Trump’s job and economic approval are both underwater by double digits (net -12 and net -11, respectively). Trump’s approval has followed a steady decline throughout Navigator’s tracking, with his overall approval at net +2 in early February, to net -9 the first week of April, to now at net -12. Trump’s economic approval has followed a similar trend, though his economic approval has improved slightly from its lowest point in late April at net -16.

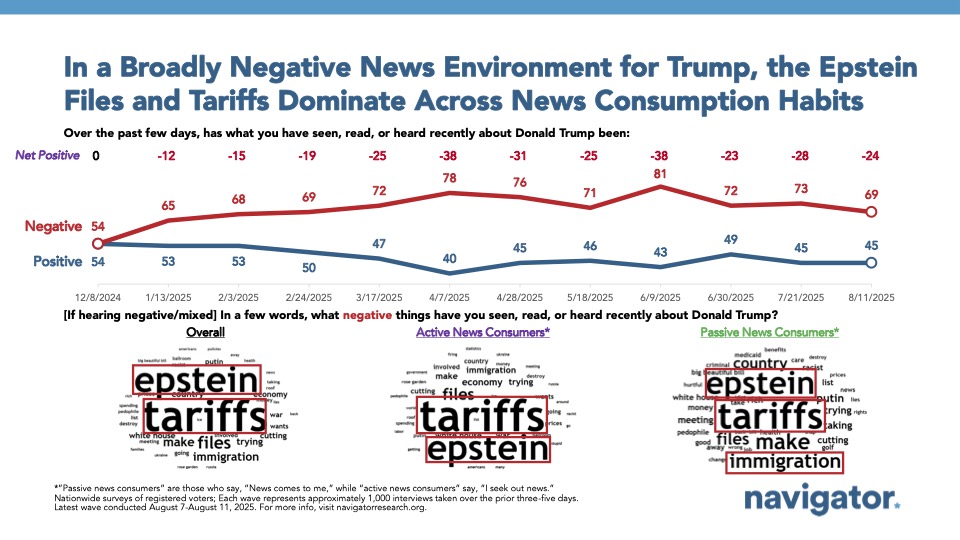
Pluralities are hearing mostly negative news about President Trump, with 44 percent hearing mostly negative news, 25 percent hearing a mix of positive and negative news, and 20 percent hearing mostly positive news. Among Americans who are passive news consumers, 39 percent are hearing mostly negative news about Trump, 25 percent are hearing a mix, 15 percent are hearing mostly positive news, and 20 percent report not hearing any news about Trump.
Phrases used to describe the positive news surrounding Trump include: tariffs, Putin, meeting, and America
Phrases used to describe the negative news surrounding Trump include: Epstein, tariffs, and immigration

Perceptions of the Economy
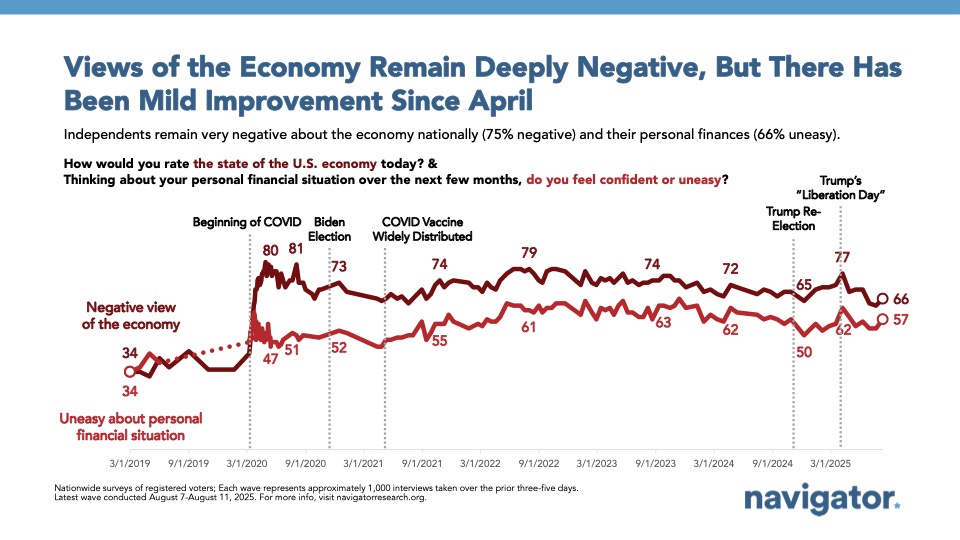
Two thirds of Americans are negative about the current state of the economy (66 percent), including 84 percent of Democrats, 75 percent of independents, and 46 percent of Republicans. While still negative, economic ratings have improved slightly from the lowest point this year in early April, where 77 percent rated the economy negatively.
Similarly, by a 17-point margin, Americans report feeling uneasy about their personal financial situations. Women under the age of 55 are the most likely to feel uneasy about their personal financial situations (66 percent uneasy – 31 percent confident) compared to men under the age of 55 who are most likely to feel confident about their financial situations (47 percent uneasy – 51 percent confident).

Half believe the economy is getting worse (50 percent), including 51 percent of passive news consumers. Americans who passively consume news are also nine points less likely than active news consumers to say the economy is getting better (18 percent passive news consumers – 27 percent active news consumers).
Trust in Handling the Issues
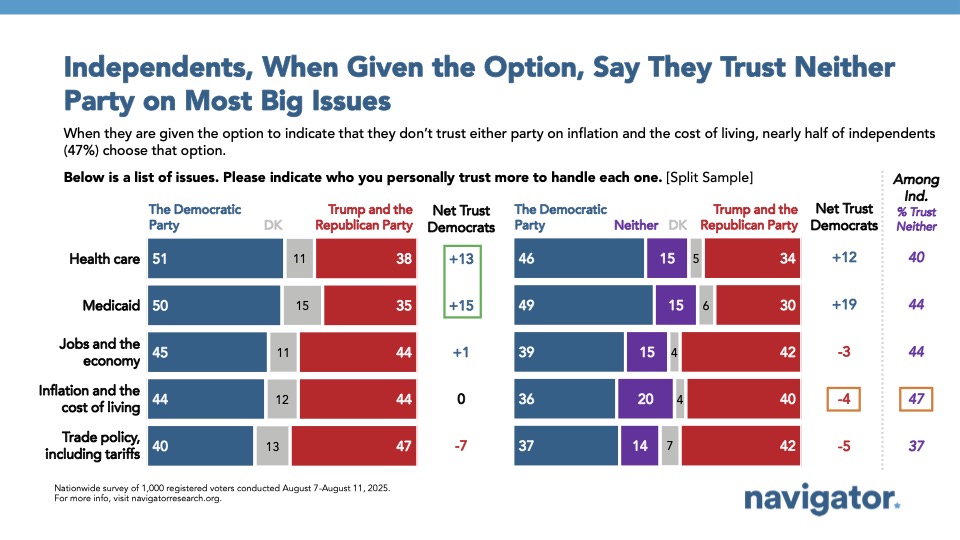
Congressional Democrats continue to hold a strong advantage over Trump and Republicans when it comes to trust in handling issues like health care (net +13), Medicaid (net +15), and education (net +9). This is especially true among independents, where Democrats hold a 32-point advantage on trust in handling health care and a 31-point advantage on trust in handling Medicaid.
Americans are more split when it comes to who they trust to handle the cost of living and the economy as a whole. On the issue of inflation and the cost of living, 44 percent trust Democrats more and 44 percent trust Trump and Republicans more. Similarly, on the issue of jobs and the economy, 45 percent trust Democrats more and 44 percent trust Trump and Republicans more. In February, Trump and Republicans had a 10-point advantage on handling inflation and the cost of living, which has steadily declined.
Notably, when given the option, pluralities of independents say they don’t trust either party to handle the issues of inflation and the cost of living or jobs and the economy.

