Poll: Trump and Congressional Democrats and Republicans
This Navigator Research report covers the latest perceptions of President Trump and Congressional Democrats and Republicans in the House Battleground.
Trump remains underwater with intense disapproval
President Trump’s job approval numbers remain consistently negative. More than half of battleground constituents disapprove of his overall job performance — with a striking 49 percent strongly disapproving. His economic job rating is worse: net approval on the economy sits at net -7 points. Similarly, Trump’s approval is underwater among independent constituents with his overall approval net -5, and economic job rating net -6.
This is slightly better than the national landscape, where Americans disapprove of President Trump’s handling of the presidency by 13 points (42 percent approve – 55 percent disapprove) and an even greater share disapprove of his handling of the economy (41 percent approve – 57 percent disapprove).
Named Democrats in Congress are outperforming their Republican counterparts, but Democrats in Congress generally remain deeply unpopular.
In a cycle where party labels are viewed skeptically, named Democratic congressional members are maintaining the favor of their constituents. Congressional Democrats sit at net +7 favorability, net +5 job approval, and net +2 economic job rating. By contrast, named Republicans in Congress are slipping with net favorability dropping 3 points (now at net -6), net -6 job approval, and a notable net -8 economic job rating, falling from February.
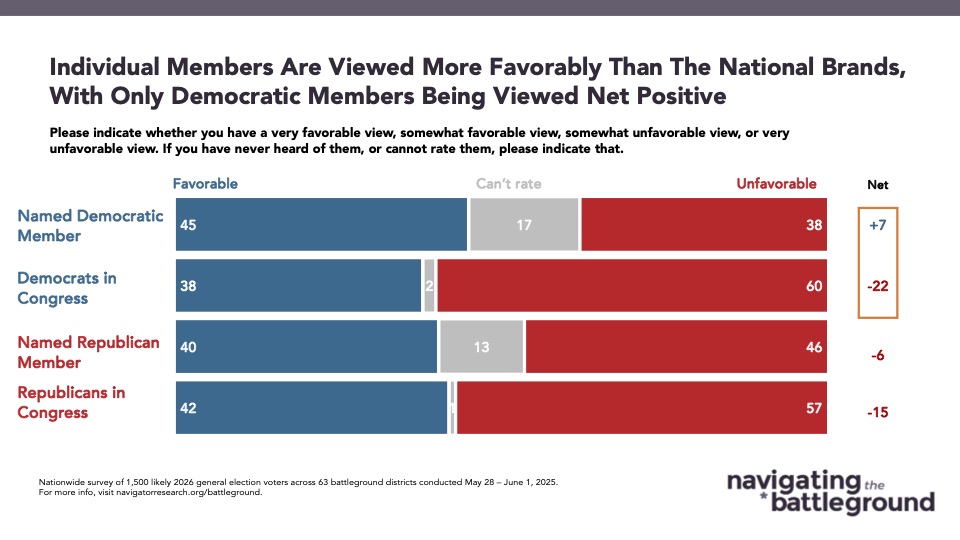
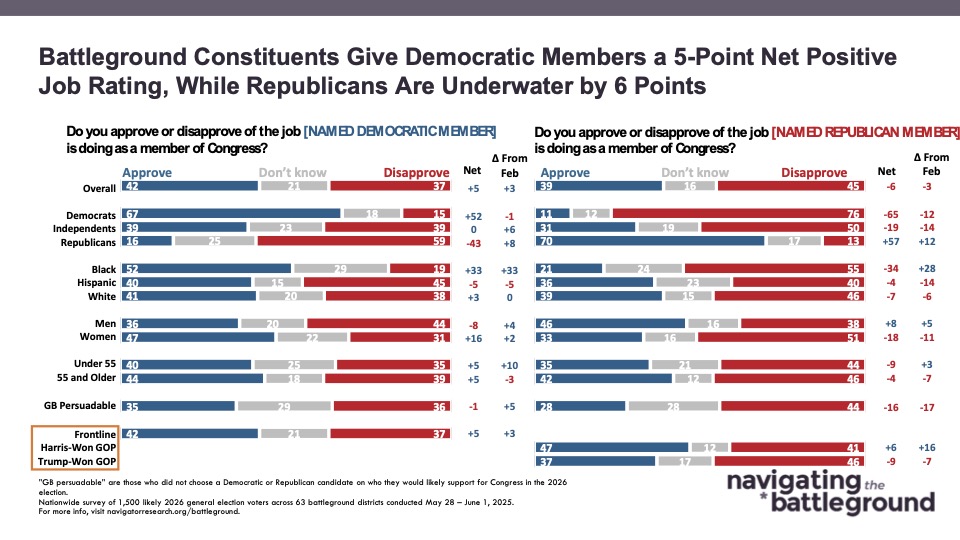
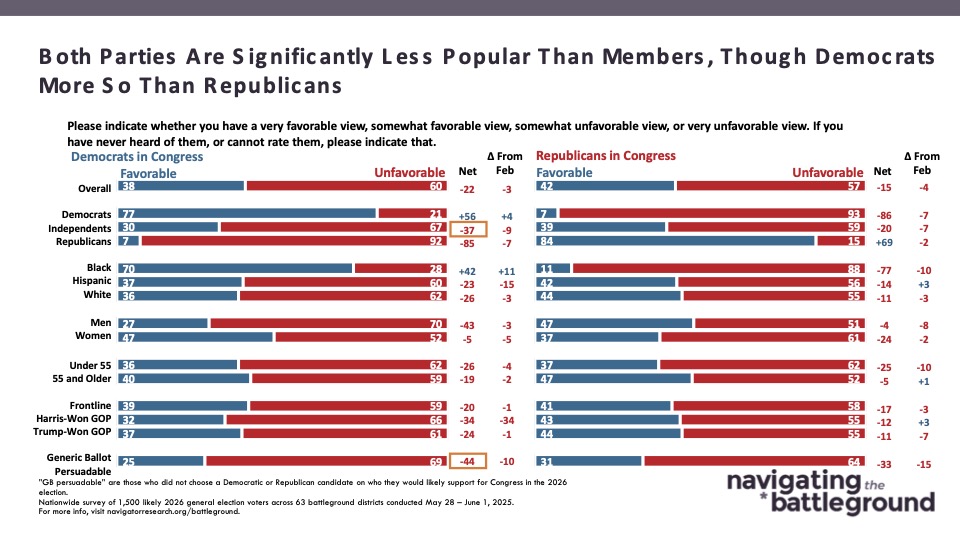
However, both Republicans and Democrats in Congress at large remain deeply unpopular compared to named members. Republicans are underwater by 15 points, a 9 point difference from named Republican members (net -6). Democrats in Congress are 22 points underwater, a 29 point difference compared to named Democratic members (net +7).
Republicans Maintain Narrow Trust on the Economy and Inflation
Republicans in Congress continue to enjoy a modest trust advantage on several core economic issues, namely, handling the economy (41 percent trust Democrats – 46 percent trust Republicans) and fighting inflation (38 percent trust Democrats – 44 percent trust Republicans).
Democrats in Congress maintain a strong lead on issues that speak to economic fairness and protecting essential programs. Specifically, making the wealthy pay their fair share (45 percent trust Democrats – 31 percent trust Republicans), protecting Social Security (49 percent trust Democrats – 37 percent trust Republicans), and protecting Medicaid (52 percent trust Democrats – 34 percent trust Republicans).
On other key measures, trust is a dead heat – including lowering costs for working families and looking out for “people like me.” A separation emerges on standing up to corporate special interests, where Democrats in Congress hold a 3 point advantage.
These mixed results show that while Republicans in Congress win the economic policy debate when the argument is on the economy in abstract, their Democratic counterparts win the debate when constituents think about who is protected, who is prioritized, and who is paying their fair share.
The Republican brand has a clear disconnect
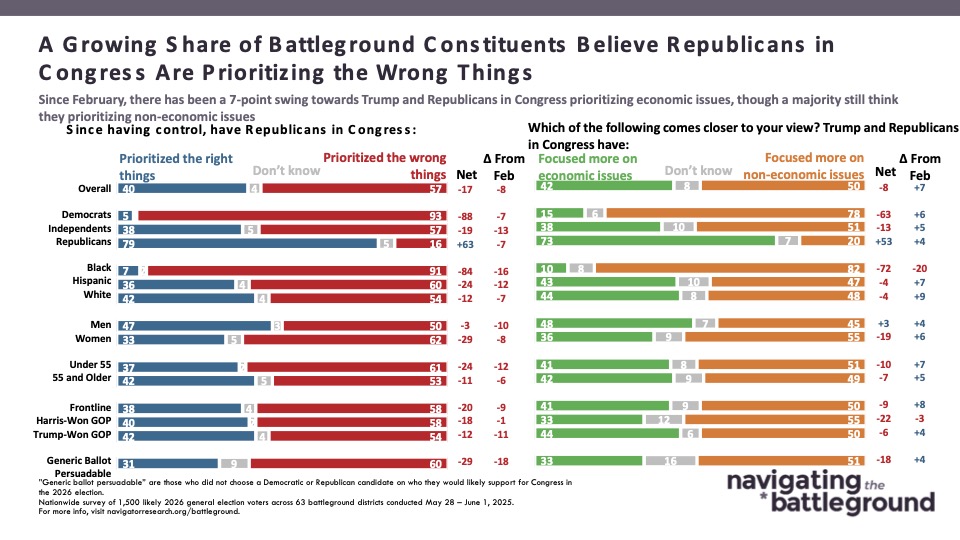
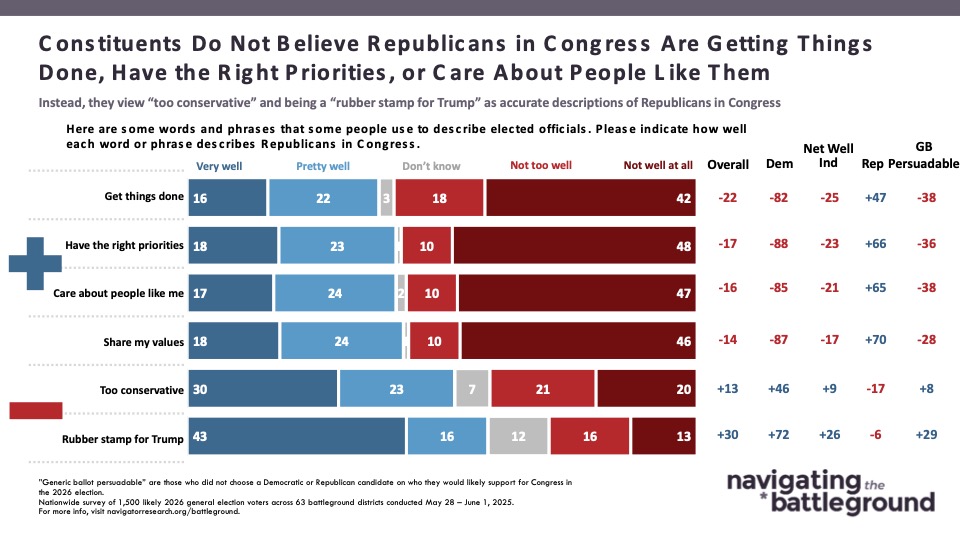
Despite their edge on inflation, constituents broadly reject Republicans in Congress’ identity and direction. Across every tested personal attribute, Republicans in Congress are failing to connect:
- Shares my values: net -16
- Cares about people like me: net -16
- Has the right priorities: net -17
- Gets things done: net -22
- Too conservative: net +13
- Rubber stamp for Trump: net +30
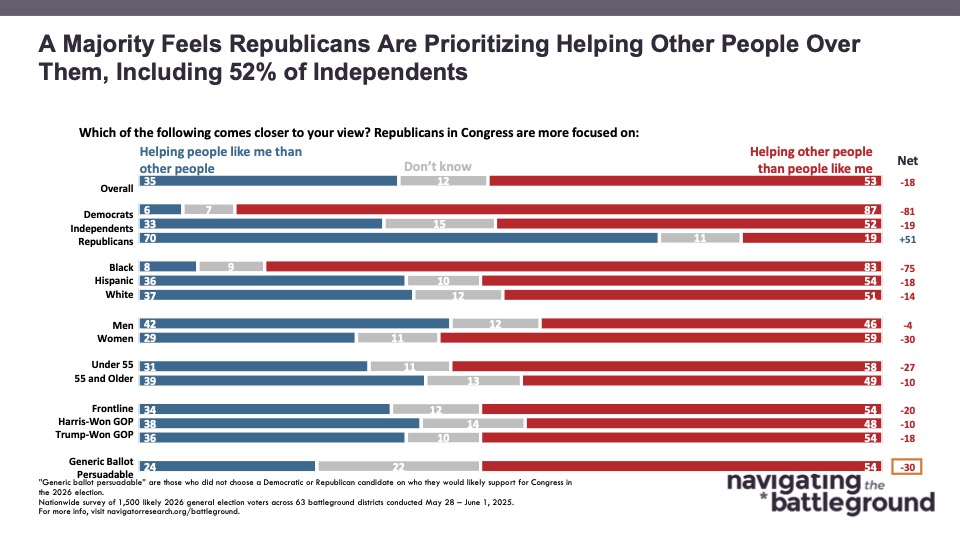
The most remarkable number may be that 53 percent of battleground constituents say Republicans in Congress are more focused on helping other people than people like them, including 52 percent of independent constituents.
Despite Trump’s unpopularity, Republicans in Congress stand resilient, especially on the economy. Meanwhile, Democrats in Congress aren’t benefiting broadly — only named members are outperforming, highlighting the value of individual brands over party labels in today’s political environment.
