Economic Journals: How Americans Experience the Economy
Since the onset of the coronavirus pandemic in the United States in March 2020, Americans have remained more pessimistic than optimistic about the state of the U.S. economy. This has been consistent over the last four years, with the vast majority of Americans rating the economy negatively and feeling uneasy in their personal financial situations. In order to gain greater insight in defining uneasiness about their personal finances, Navigator and GBAO conducted a qualitative research project asking more than 30 participants from across the country about their economic outlook, daily spending habits, economic news consumption, and expectations of government when it comes to managing the economy.
Political and Economic Sentiment
Many study participants felt pessimistic about the state of their local areas, describing themselves as “worried,” “concerned,” and “anxious.” This was largely due to rising political tensions related to the upcoming presidential election and rising prices contributing to a more difficult quality of life. One participant expressed feeling: “Unstable. I picked that word because everything feels very up in the air right now, prices are increasing with inflation, it’s very hard to make ends meet, the country in regards to politics keeps going backward when it comes to rights.” When explicitly asked to state what is going well in their local areas, many mentioned new construction projects, small businesses opening, and increasing home values. However, a significant share remained pessimistic, saying “nothing” or “not much” is going well in their area.
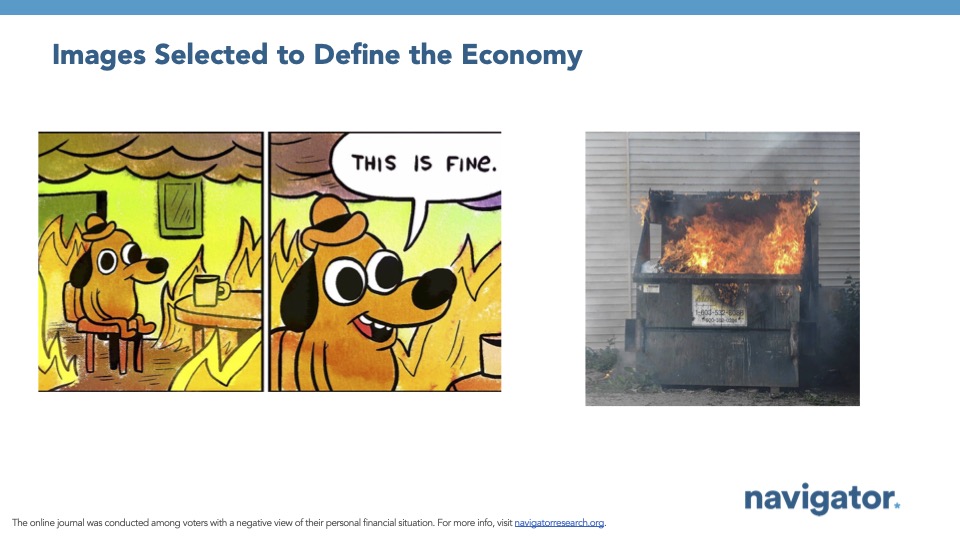
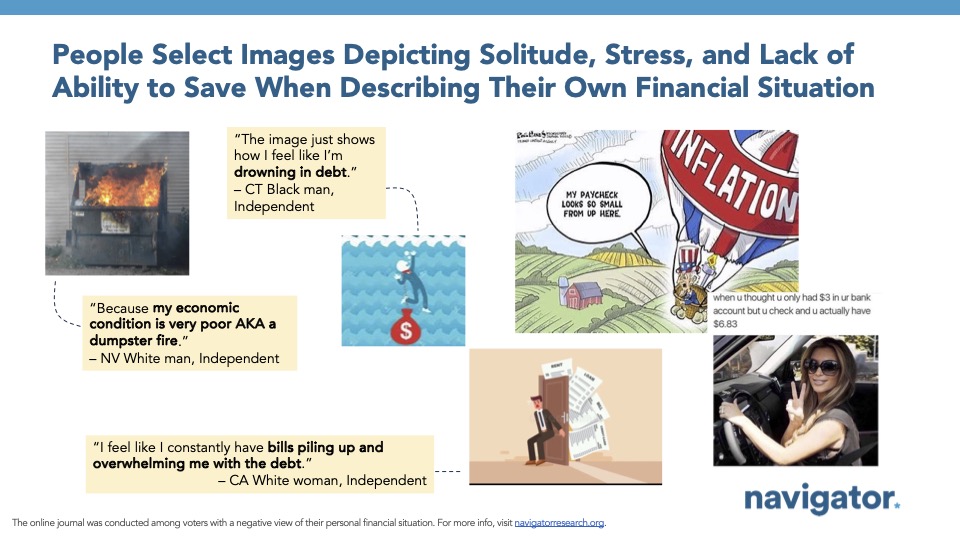
Similarly, when asked to describe the state of the country, many chose negative descriptors such as “uneasy” and “horrible.” Assessments were driven by political polarization, disappointment with U.S. engagement in foreign affairs, and the increased cost of living. When asked to select an image online that participants felt best illustrates how the economy is doing, many chose images of destruction, with notable examples including a dumpster on fire, a broken American flag, or sitting in a coffee shop surrounded by flames. The participant who selected an image sitting calmly in a burning building picked this image because they felt the economy was doing poorly due to rising costs, but reported hearing the opposite from politicians. Additionally, there were several mentions of a disappearing middle class exacerbated by rising prices. This negative economic sentiment mirrors the most recent national survey data from Navigator, in which more than two in three Americans rate the economy negatively (68 percent) with a similar share who rate the economy in their community negatively (62 percent).
- One participant in describing why they selected an image of two broken buildings in describing the economy expressed: “I picked this image because it represents how the economy is basically crumbling down and making it hard to live within the means. It also shows a separation between two buildings and that for me basically shows how the country is divided. It is straight rich versus poor.”
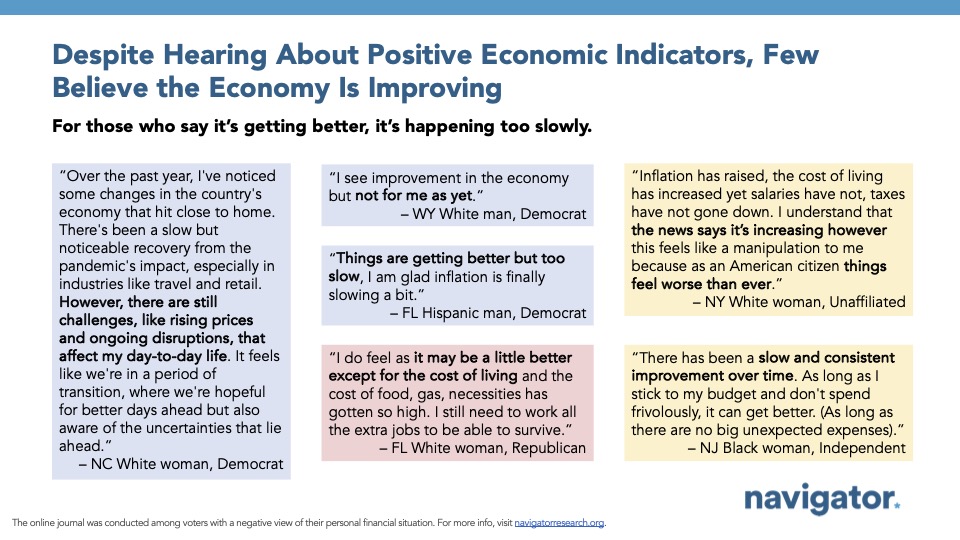
- Participants were split as to whether the economy has improved or deteriorated in the past years. Few felt inflation easing:“Things are getting better but too slow, and glad inflation is finally slowing a bit.” Others blame a worsening economy on increasingly higher prices: “I feel like things are getting worse from last year. A lot of companies are raising prices on products and services. People are being laid off or hours are being cut which seems to be worse than last year.”
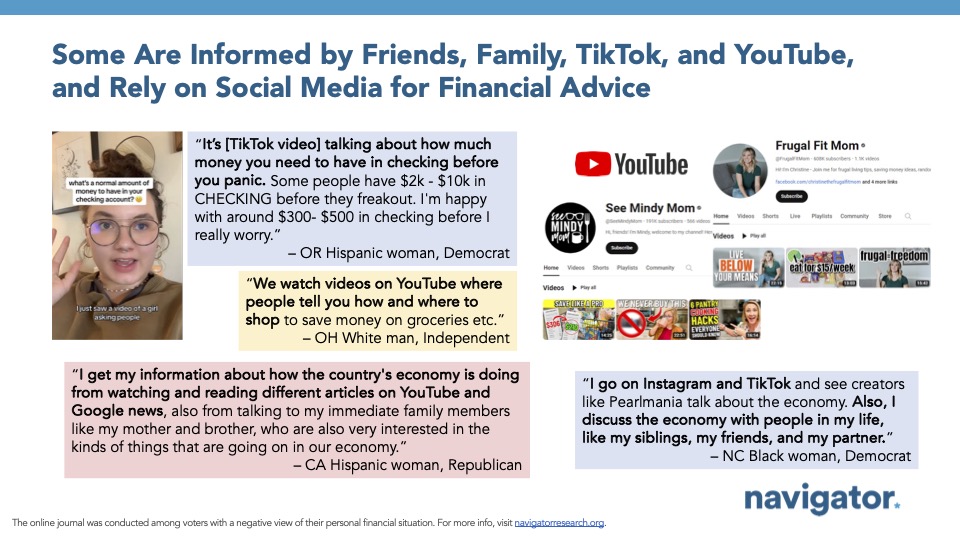
- Few participants report reading or following mainstream economic news and primarily use social media as a means of obtaining economic information: “I am starting to see some people complaining about the cost of groceries and life in general through memes on Instagram and ranting on TikTok, however I still think those people come from a decent financial situation that isn’t as horrible as mine.” Additionally, there were a notable share of mentions of people avoiding reading news about the economy: “Honestly I avoid the news about the economy… it isn’t MY economy, it’s the rich man’s economy and trickle-down has never worked and never will. Greed rules the economy.” Participants also reported using social media for financial advice: “We watch videos on YouTube where people tell you how and where to shop to save money on groceries, etc.” Similarly, another participant said: “I like to watch Clear Value tax and frugal living channels like this one.”
Personal Economic Experience
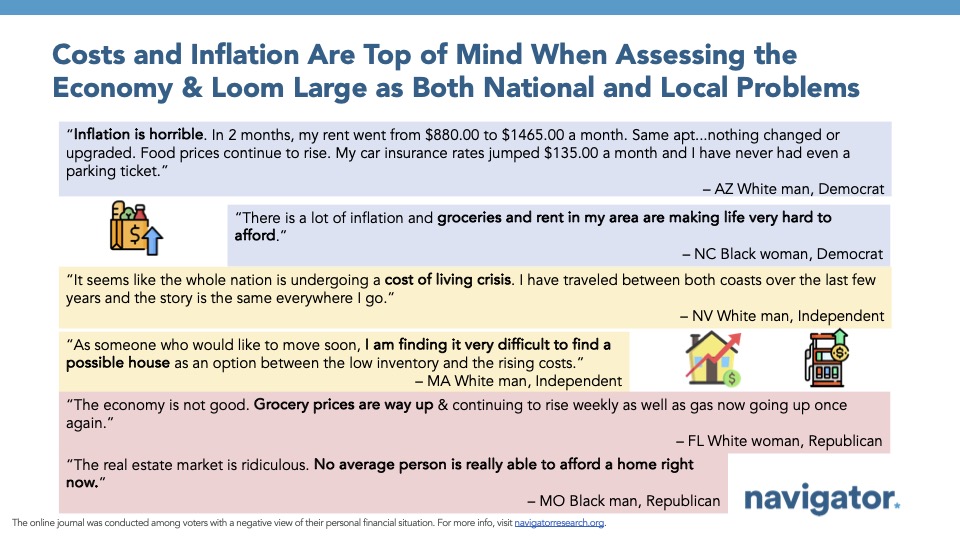
Daily costs, such as housing, food, and gas prices are the main indicators participants use to determine the strength of the economy. As one participant put it: “Real factors that impact our lives every day.”
Participants used daily expenses like food prices to determine if the economy is doing well, with few mentions of macroeconomic indicators, such as the stock market or the unemployment rate. A Navigator survey conducted in January 2024 similarly found 89 percent of Americans use at least one personal economic indicator to judge the strength of the overall U.S. economy, with the most common indicators used to assess the economy being the cost of living (74 percent), the rate of inflation (67 percent), distantly followed by personal household income (33 percent). Macroeconomic indicators, including the GDP growth rate (20 percent), performance of the stock market (15 percent), and the global supply chain (11 percent) were among the least utilized to judge the strength of the economy.
- One participant expressed: “Rent has doubled over the past 10 years and it’s not like [it] was exactly [easy] to make rent back then either.” Others feel increased interest rates are making purchasing a home or an apartment increasingly less attainable. Many feel they are able to purchase fewer daily goods due to increasing prices: “A few bags of groceries cost about $100 now. Just a few years ago I would have about 8 bags of groceries for the same price.”
- A vast majority of participants feel the rising prices of housing and groceries, and stagnant salaries are getting worse: “Gas prices surprise me a little bit because they’ve gone up and it just seems crazy because I remember whenever they were at a $1.70 when I was a kid which was a long time ago so makes me sound old but now it’s up to a $5 a gallon which is crazy to me.”
Many feel uneasy about their personal financial situation, using descriptors such as “nervous,” “scared,” or “stressed” with fewer saying they feel “okay” or “optimistic.” Common reasons for uneasiness are inability to save and worrying about impending rising prices. This is similar to a March Navigator survey that found three in five Americans feel uneasy about their personal financial situation (57 percent). Participants point to the ability to pay their bills or steady income as what is going well in their personal financial situations. Conversely, a vast majority point towards an inability to save or being burdened by debt as contributors of unease in their own personal financial situation.
When selecting an image to depict how participants felt about their personal financial situation, many chose images that depicted solitude and stress. One participant explained:“I feel like I constantly have bills piling up and overwhelming me with the debt.” Likewise, another participant said: “A lot of the time I feel like my financial situation is really bad, but put on a good face and try to keep a good mindset about it.” Another participant wrote: “I feel like the money is never enough. A constant race of movement forward to get more” about selecting an image of a an empty wallet only containing a sad post-it note, and another participant wrote after selecting an image of someone relaxing: “I chose this picture because I am longing for the day I don’t have to stress about money everyday” and “it just doesn’t add up how much everything costs.”
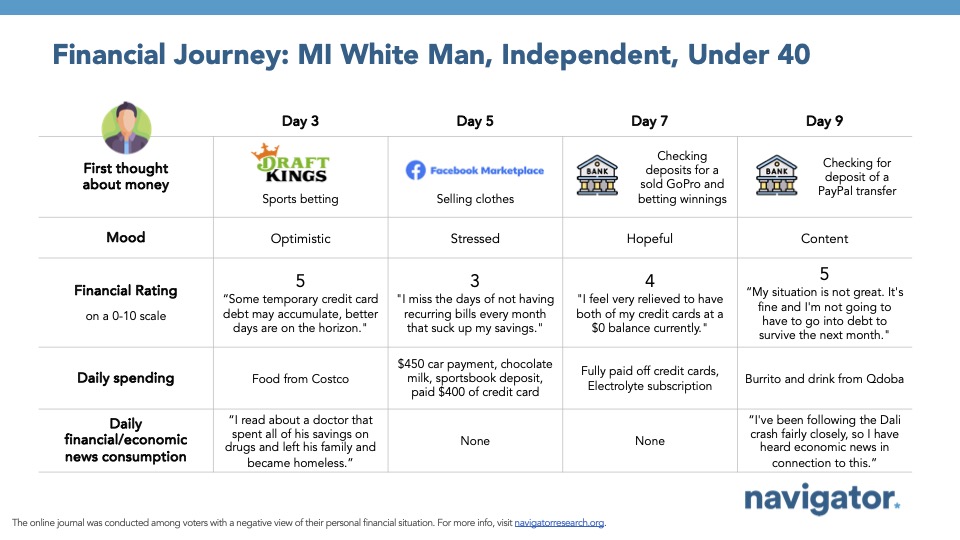
These participants were asked to rate their personal financial situation from a zero through ten scale (ten meaning most confident). A majority of participants selected a range between three and six, utilizing descriptors such as “[I can] maintain,” “I feel stuck and behind but also still able to meet the essentials,” and“it’s fine and I’m not going to have to go into debt to survive the next month.” A rating of three to four mainly encapsulated the ability to barely make ends meet, as one participant described: “It’s just that I need more hours to make enough money and survive and save money.” A rating of five to six, meanwhile, captured the capability to make ends meet absent of secured disposable income:“I make enough to get by, but not nearly enough. I would be happier if I had extra money to spend on buying a car or going on vacation.” Nearly all participants described themselves in the middle of this zero to ten scale, citing having secured housing and basic necessities, but also an inability to indulge in luxury goods beyond necessities.
- Participants were mixed as to whether their personal financial situation was better or worse two years ago. Those who felt it was better two years prior pointed to having a greater ability to save due to lower costs, while those who felt it was worse two years ago point to the start of the pandemic and the ensuing job insecurity or career growth in recent years.
- Many participants point to increased utility bills and receipts for food prices as evidence of increasing costs, with mentions of being burdened by various debts: “My student loan bills. They eat up most of my money and make me feel like I can’t get ahead.”
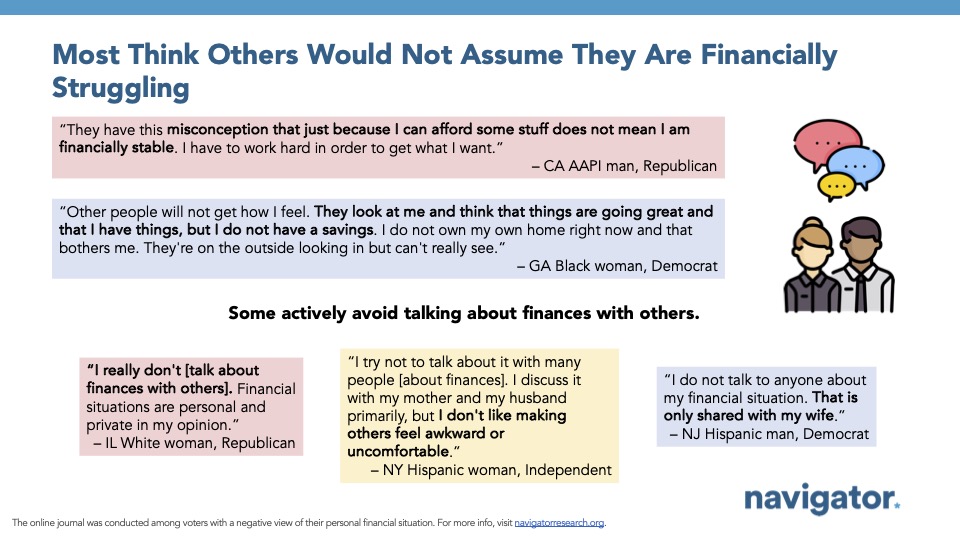
However, only a few report discussing finances with others: “I really don’t. Financial situations are personal and private in my opinion.” Among those who do discuss finances with others, the conversations are qualified by the infrequency or the generality of the conversation: “I’ve been talking with friends and family about how things are getting more expensive and harder to pay, and we are not able to keep up with inflation.”
- Participants feel misunderstood by others in terms of how dire individuals feel about their personal finances. One participant said: “[Others do not understand] how I work a ton of hours yet still don’t have expendable income.” Another participant expressed: “No one knows how much debt another person is carrying or what their financial stressors are.”
Daily Economic Concerns
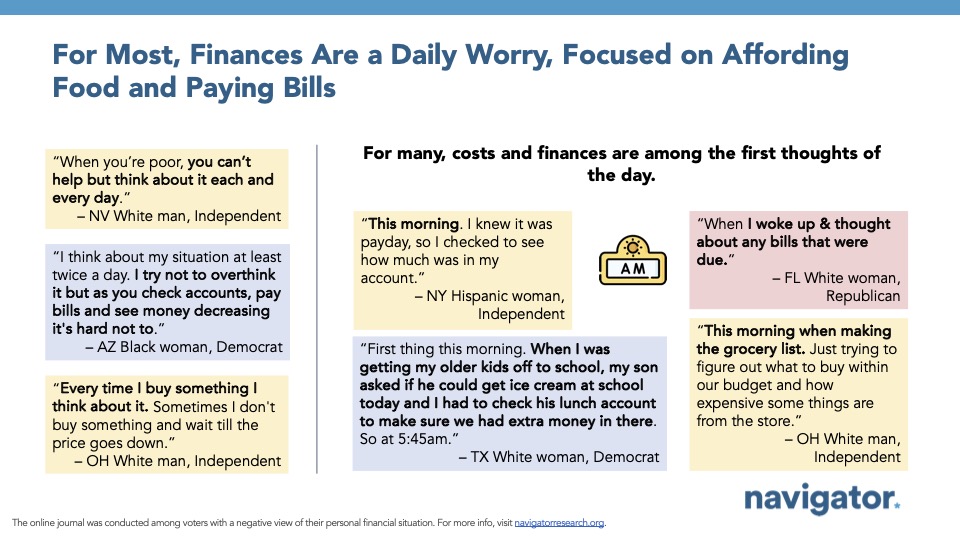
For four days of these journals, participants were asked to record daily spending habits including: when did they first think about money, what did they spend on, and daily strategies enacted to save money. These journal entries revealed a majority of participants think about personal finances first thing in the morning, which immediately results in feelings of stress and anxiety. Almost all participants cite thinking about their finances either every day or almost everyday, including participants who said “[money] crosses my mind every day” and “when you’re poor, you can’t help but think about it each and every day.” Further, most report thinking about finances when waking up in the morning, usually prompted by thinking about upcoming bills, with one participant saying “right when I woke up. I think about what bills need to be paid on payday Friday” and another saying “this morning when I had to pay a bill.” Other instances were when participants wanted to purchase food or daily items: “First thing this morning… my son asked if he could get ice cream at school today and I had to check his lunch account to make sure we had extra money in there.” Another said: “When I was leaving for work and I was ready to gas up my car… I was thinking whether or not to fill up halfway or fully tank my car.”
- “I first thought about money in the morning like I always do. Worrying about future bills and paying off debt,” wrote one participant. “I was on my way to work and the trains were running local and I didn’t have enough money to just take an Uber” and “I was thinking about how I was going to pay for groceries this week.”
- Participants reported feeling “anxious” and “stressed” due to an inability to keep up finances: “Just knowing that my current finances aren’t what they need to be in order to survive in this economy.” Participants were also worried about the ability to pay upcoming bills:“I feel overwhelmed always making sure I have enough money to pay my bills and expenses.”
- Extrapolating daily sentiment about personal finances to one’s overall financial situation instigated feelings of hopelessness for the future:“[I feel] anxious just because I would like to know in the future that I will make more money enough to save money each month.” Others expressed similar feelings, including one participant who said: “I feel discouraged because I am sick of feeling poor. But I feel determined to find any kind of way to bring money in” and another saying “[I feel] depressed. Just feel like I can’t get ahead.”
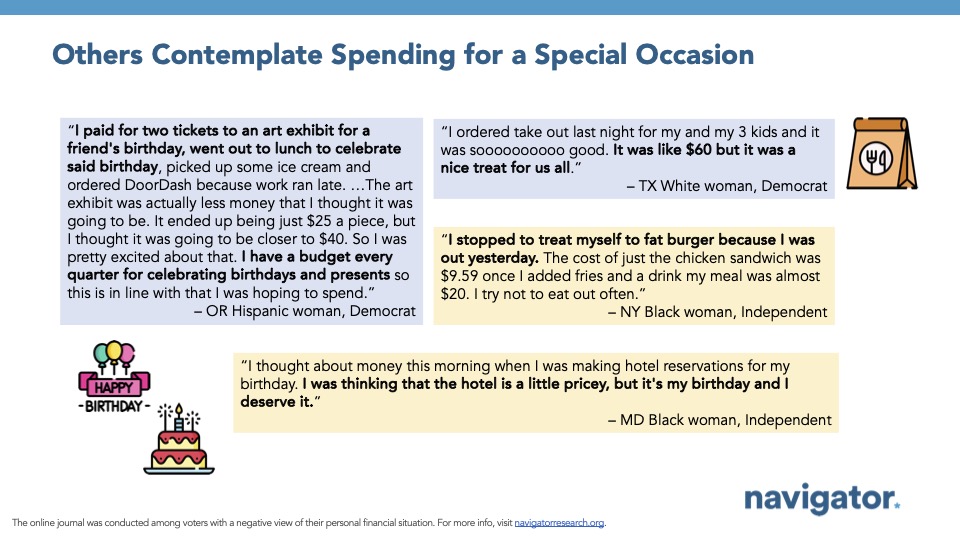
On a daily basis, participants reported spending money on credit card bills or food, and although the costs were not surprising, there was general disappointment and frustration with high prices. Many reported using coupons as a technique to keep costs low. When recounting expenses within the last 24 hours, many reported paying off credit card bills, utility bills, buying groceries, or going out to eat. Most were unsurprised by monthly bills, citing that they remain somewhat the same each month. Food and grocery prices were noted as causing participants to buy non-name brand or on sale items to tamper the costs:“[I] have to shop at different stores to save money… [I] use coupons and get specials.”
- Going out to eat was the most surprising cost, with participants saying things like “the cost of lunch was surprising… It was a grab and go place, but it was still $40 for two people” and “I bought fresh chicken wings from the supermarket and they were 20% more expensive than the ones I bought last time around a year ago.”
- Participants reported only buying necessities when at the grocery store: “We went to the supermarket. There were items that were higher than anticipated but we stuck to buying items that were on sale or that we needed. We didn’t buy any luxuries.” Many also cited using coupons: “My wife uses a thing called ‘Flash Foods,’ you get discounted items at the grocery store. Saves from 50 percent up on meat, fruit, etc.”
Perceptions of the Middle and the Working Class
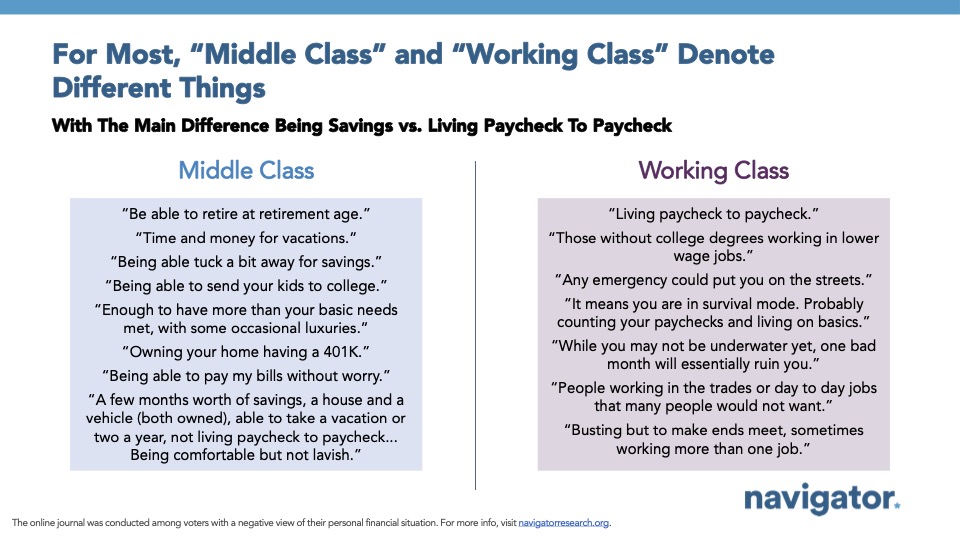
The primary difference participants saw between “the middle class” and “the working class” is the ability to save and plan for a financial future. When asked to define the middle class, one person said simply: “Someone who is neither rich nor poor.” Many cited that the middle class should have the ability to save, possibly own a home, and have investments into the future, such as a 401(k): “‘Middle class’ to me is being able to pay your bills with little to no trouble while also being able to indulge in life’s pleasures. Owning a home, having a nice car, being able to go on vacation annually, etc.” There were a notable number of participants feeling that the middle class is disappearing, or that the singular 9 to 5 job typically able to cover expenses comfortably no longer exists: “There is no middle class anymore. When I was growing up my dad worked one job. Could afford to buy a house, we took vacations, mom was a stay-at-home housewife. Now people must work 2 to 3 jobs to barely keep heads above water.”
- Conversely, the working class was often described as “living paycheck to paycheck” or being “in survival mode.” Some descriptions were even more distressing, including one participant saying that “any emergency could put you on the streets” and another participant saying “…while you may not be underwater yet, one bad month will essentially ruin you.” Other descriptors included the type of work people did, such as manual labor or trade jobs.
- However, there were multiple participants who felt the working and middle class were synonymous: “Working class and middle class to me are the same. You have to go to work everyday and work hard to bring home a medium amount of money that still leaves us without enough money and needing more and a better life.” Another said: “Working class is similar to middle class, it gives me the impression of factory workers in the Industrial Revolution. I define it as people who work jobs everyday, not own a business.”
Economic Expectations and the Role of Government
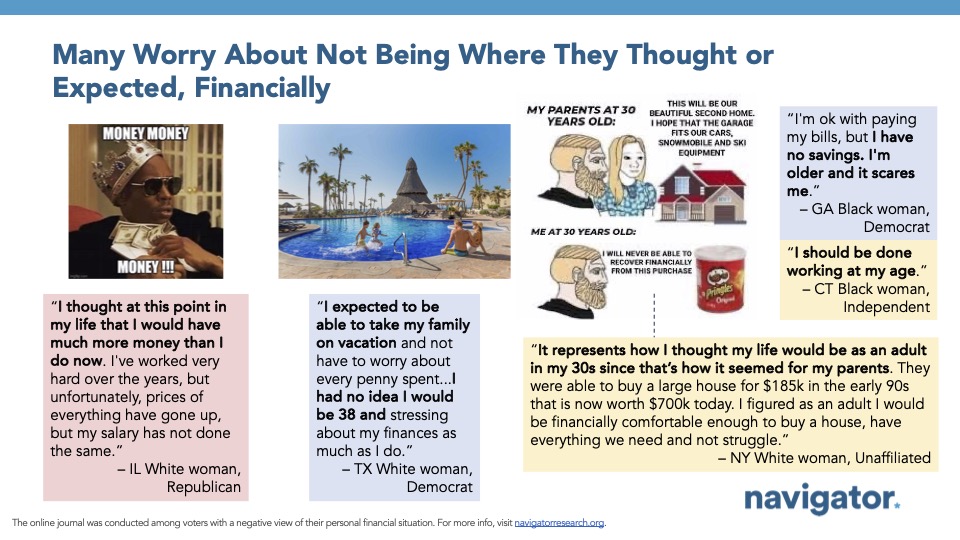
Almost all participants were expecting to be more financially secure at this stage in life, with hopes of home ownership, savings and the ability to travel, and feeling “financially comfortable” overall. When selecting images depicting how participants thought their economic situation would look at this stage of life, many chose images depicting homeownership, while others picked pictures of savings, such as stacks of cash or a mason jar of money. Recent data from Navigator found that while nine in ten Americans at least once thought that if you work hard you will get ahead (89 percent), only 31 percent of Americans still believe that is true while three in five Americans believe that it was once true but now longer is (59 percent).
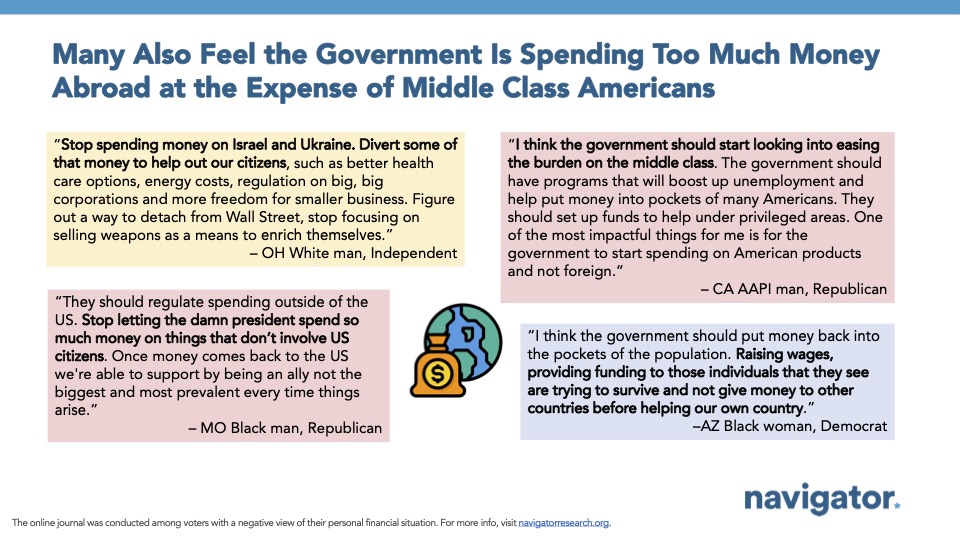
When asked how the government could improve the economy, the primary actions that participants wanted to see were easing the costs of housing, tuition, and student debt. Many participants stated they wanted the government to enact programs that would lower costs: “I think the government should enact rent control, universal health care, and raise the minimum wage. For me personally, rent control would be the most impactful as I don’t have a ton of medical expenses and do not make minimum wage.” There were multiple mentions of government assistance in affordable housing, and generally “putting more money into the middle class.”
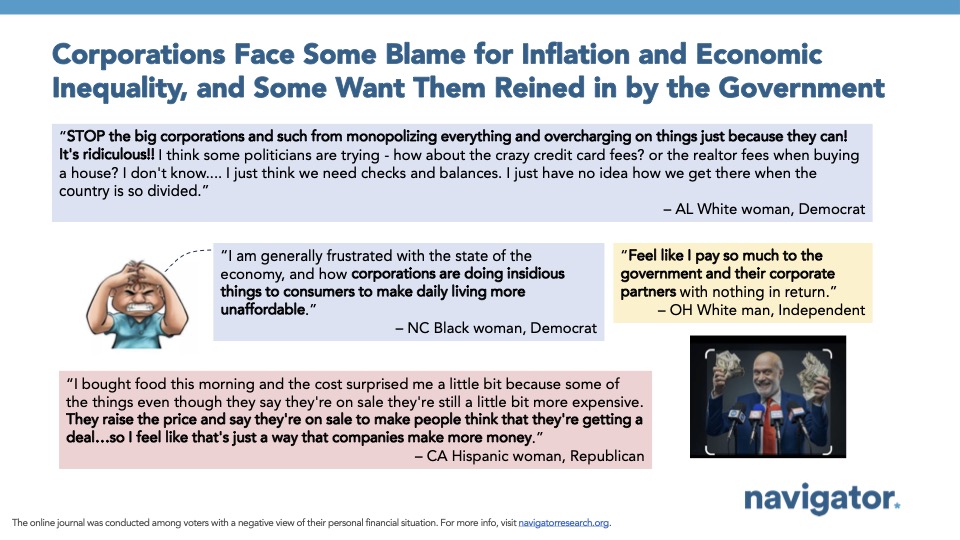
- Throughout these journals, many participants blamed corporate greed as a contributor to higher prices and their lack of economic mobility, with one participant saying “[I’ve been] living relatively comfortable compared to a lot of people in the country but still beholden to the corporate world and what scraps they let me have,” and another saying “I am pretty unsatisfied due to issues of corporate greed and unfairness.” To that end, some participants saw a role for the government to address profiteering by raising taxes on large corporations who are exploiting tax loopholes that they themselves were not benefiting from: “Quit being controlled by corporations. Ensure workers raises match inflation. Tax increase[s] for the rich. It’s time to end all these tax breaks.”
- A Navigator survey conducted in November 2023 found a vast majority of Americans support increasing funding for retirement programs like Social Security and Medicare (82 percent), nutrition assistance for children and vulnerable families (76 percent), and health care, including Medicaid and the Affordable Care Act (76 percent). Meanwhile, cutting funding for any of the aforementioned programs is deeply opposed by a minimum of three in four Americans.
- More recent Navigator polling found that four in five support raising taxes on the rich and big corporations (79 percent), including over nine in ten Democrats (94 percent), three in four independents (73 percent), and two in three Republicans (63 percent).
About The Study
GBAO conducted a two-week discussion board (March 18-29), with 34 voters across the country who have a negative view of their personal financial situation, to answer baseline questions on the economy and their finances and journal about their spending and economic news habits. Some quotes have been lightly edited for brevity. Qualitative results are not statistically projectable.
