Poll: Policies to Support Families
This Navigator Research report contains polling data on how well Americans see the United States when it comes to helping families with health and financial challenges, which government programs that would help families with children are most popular, and who Americans see as most trusted to handle caring for children’s wellbeing.
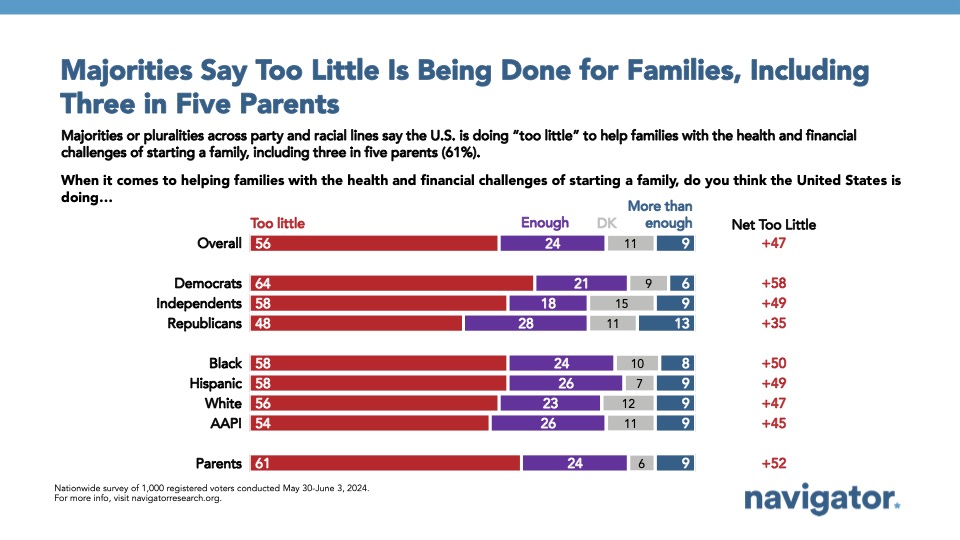
Most Americans think the United States is doing too little to help with the health and financial challenges of starting a family.
As the cost of starting a family is becoming increasingly more expensive for Americans, a majority believe the United States is not doing enough to help. By 32 points, a majority of Americans say the United States is doing too little to help families with the health and financial challenges of starting a family (56 percent) compared to just a quarter who say enough is being done to support families (24 percent). Three in five of those under the age of 35 (62 percent) and parents (61 percent) — including two in three mothers (67 percent) and half of fathers (52 percent) — say the United States is not doing enough to support families.
- Those living in households earning less income are more likely to believe the United States is doing too little to support families, including 59 percent of those living in households earning less than $50,000 per year and 56 percent of those living in households earning between $50,000 and $100,000 per year, though have of those living in households earning more than $100,000 a year say the same (50 percent).
- A plurality of Americans trust President Biden and the Democratic Party more than the Republican Party to “care for children’s well-being” by a 9-point margin (46 percent trust Biden/Democrats – 37 percent Republicans).
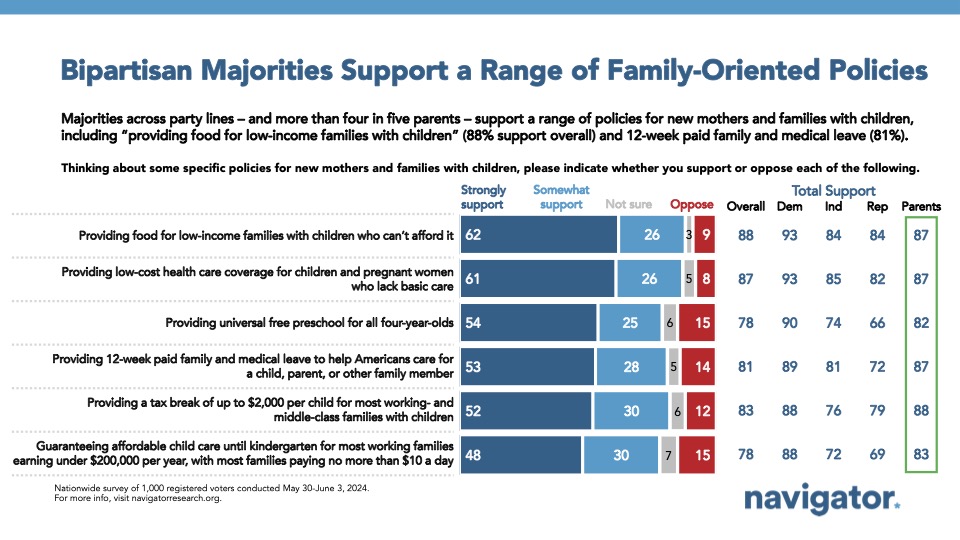
Bipartisan majorities support a range of family-oriented policies.
More than three in four Americans, including majorities across party lines, support reforms to help families including food assistance programs, accessible and affordable health care, universal pre-K, and 12 weeks of paid family and medical leave. 88 percent of Americans support “providing food for low income families with children who can’t afford it,” including 62 percent who say they “strongly” support it. More than four in five Americans also support “providing low-cost health care coverage for children and pregnant women who lack basic care” (87 percent, including 61 percent who “strongly” support this), “providing a tax break of up to $2,000 per child for most working- and middle-class families with children” (83 percent, including 52 percent who “strongly” support this), and “providing 12-week paid family and medical leave to help Americans care for a child, parent, or other family member” (81 percent, including 53 percent who “strongly” support this). Each of these programs earns support from about nine in ten Democrats, at least three in four independents, and at least seven in ten Republicans.
- Other policies that earn support from nearly four in five Americans include “providing universal free preschool for all four-year-olds” (78 percent, including 54 percent who “strongly” support this) and “guaranteeing affordable child care until kindergarten for most working families earning under $200,000 per year, with most families paying no more than $10 a day“ (78 percent, including 48 percent who “strongly” support this).
About The Study
Global Strategy Group conducted a public opinion survey among a sample of 1,000 registered voters from May 30-June 3, 2024. 100 additional interviews were conducted among Hispanic voters. 75 additional interviews were conducted among Asian American and Pacific Islander voters. 100 additional interviews were conducted among African American voters. 105 additional interviews were conducted among independent voters. 200 additional interviews were conducted among voters ages 18-34. The survey was conducted online, recruiting respondents from an opt-in online panel vendor. Respondents were verified against a voter file and special care was taken to ensure the demographic composition of our sample matched that of the national registered voter population across a variety of demographic variables. The margin of error for the full sample at the 95 percent level of confidence is +/- 3.1 percentage points. The margin for error for subgroups varies and is higher.


