What do Americans want to fund? Not ICE, not war, not a ballroom. Healthcare.

I went shopping for healthcare and decided I can either have healthcare or I can eat and pay rent.” – NC woman, uninsured (Navigator Focus Group, 4/23/26)

Americans are already feeling the impacts of the July 2025 Republican budget cuts which skyrocketed the cost of healthcare and made it harder to access food for families who need it. With another funding fight coming in Washington over the 2026-2027 federal budget, it’s an imperative for leaders to communicate support for programs that help everyday Americans. 

The bottom line: Americans want elected leaders to prioritize the issues that impact them here at home, not make their lives harder and more expensive. They view further cuts to healthcare and food assistance as a non-starter. An effective message on the funding fight positions Congressional Democrats as on the side of everyday people, centers the real-life impacts of the budget cuts, and provides a clear contrast with what Republicans want to fund: tax cuts for billionaires, ICE, and foreign conflicts. 

What The Data Is Showing

This funding fight is a valuable messaging opportunity because Americans are already primed to feel that President Trump and Republicans in Congress are focused on the wrong priorities. They believe Congress should address the issues that impact their day-to-day lives, like the cost of living, economy, and healthcare, while Republicans in Congress are focused on brutal and unpopular immigration enforcement as well as costly and dangerous foreign conflicts.
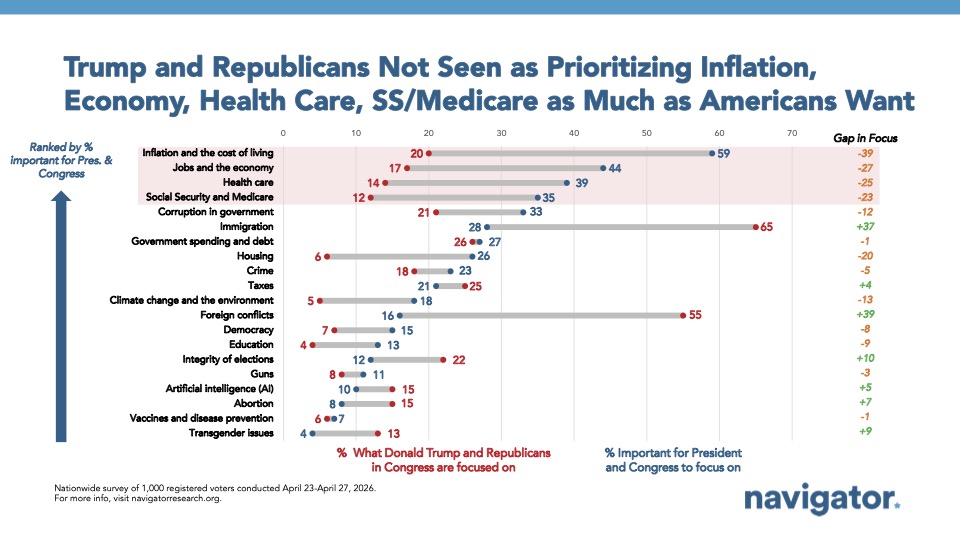
Dot plot from Navigator Research titled: Trump and Republicans Not Seen as Prioritizing Inflation, Economy, Health Care, SS/Medicare as Much as Americans Wanted

Democrats enter this conversation with advantages in party trust on many of the issues Americans want the President and Congress to prioritize: healthcare, the cost of living, and “looking out for people like me.” However, the challenge is making sure Americans can see and hear the Democratic message. 

Over half of passive news consumers, those who do not seek out the news but rather have it come to them, have heard little to nothing about the current funding fight. But many of these same Americans are concerned about ICE brutality and healthcare cuts. This is a valuable opportunity to drive home the message that Republicans in Congress do not have the right priorities, especially to reach those who are not actively paying attention. Passive news consumers are much more likely to scroll through their feeds and have the news find them rather than seek it out. Communicators need to prioritize creative messengers and mediums that can game the algorithm in order to reach these Americans.  

  • Magnify your audience on the mediums you are already on. Social media collaboration posts with larger accounts or creators can easily put your content in front of audiences that you wouldn’t normally reach. 
  • Pick a fight. Social media feeds off of confrontation, be strategic about inserting yourself into the news cycle by pairing typical congressional content with more creative angles (Example: @repsarajacobs).
  • Diversify your audience. Go on podcasts or YouTube shows, especially those not strictly focused on political topics to reach a new audience.
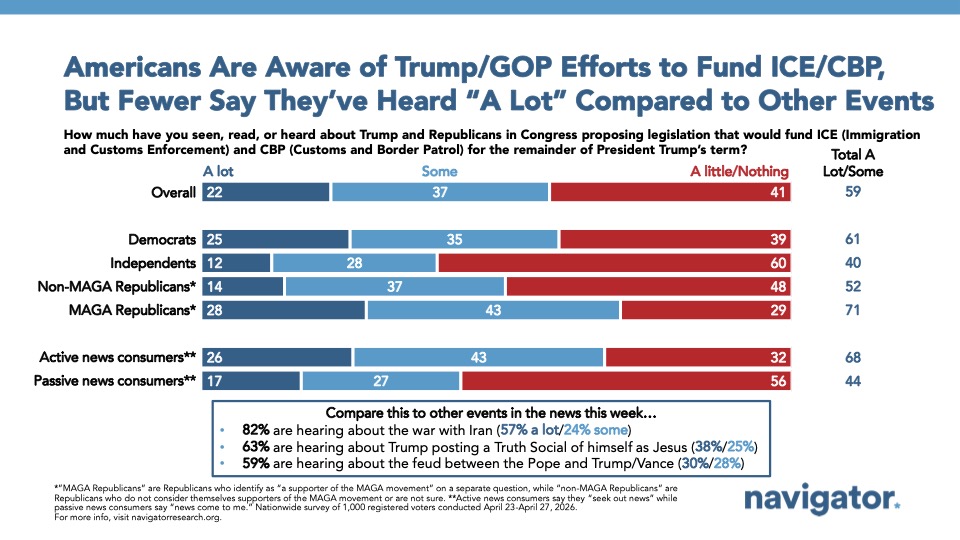
Bar chart from Navigator Research titled: Americans Are Aware of Trump / GOP Efforts to Fund ICE / CBP, But Fewer Say They've Heard "A Lot" Compared to Other Efforts

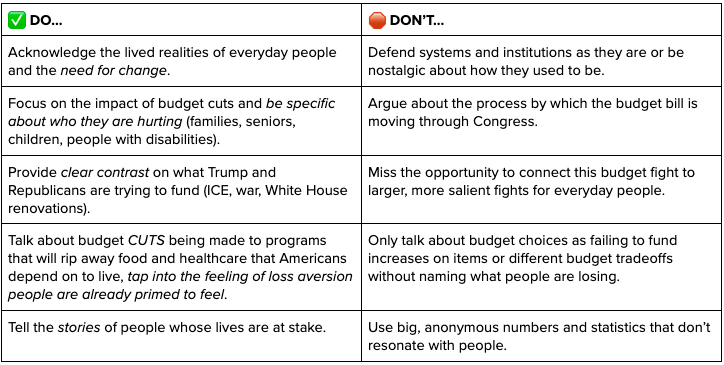
With public support  for ICE at historic lows, Americans’ top concern about the Republican budget – which allocates billions to ICE – is the cutting of billions from healthcare and food assistance, especially as those costs continue to rise. However, Americans are not concerned about the process by which the budget is passed. An effective communications strategy around this funding fight must first and foremost center the impacts on families across the country. 
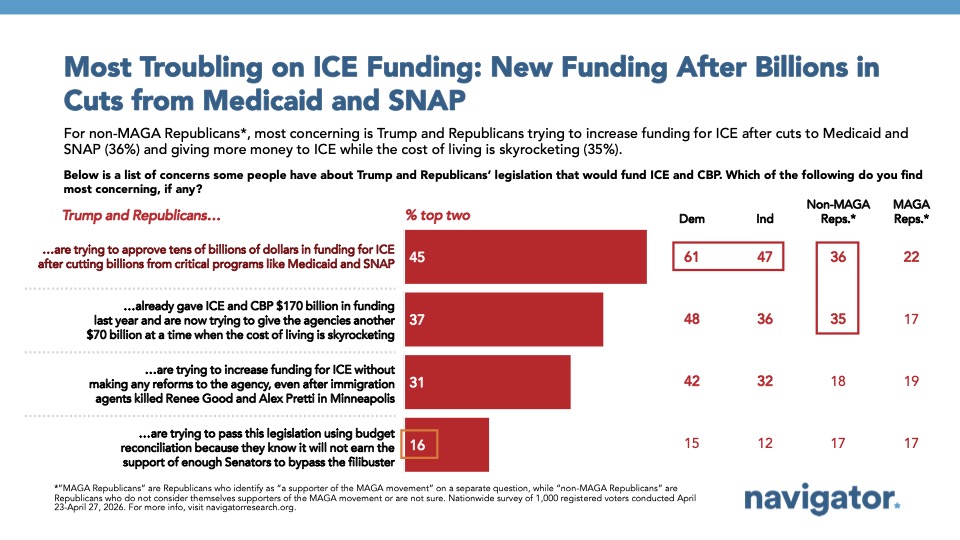
Bar chart from Navigator Research titled: Most Troubling on ICE Funding: New Funding After Billions in
Cuts from Medicaid and SNAP

Cuts to healthcare and food assistance are deeply unpopular, especially when contrasted with what President Trump and Republicans in Congress actually want to spend the money on. Americans don’t want tax cuts for the rich, or an expensive and dangerous war, or more funding for ICE, or a White House ballroom. They want to be able to go see a doctor when they need and put food on the dinner table. 
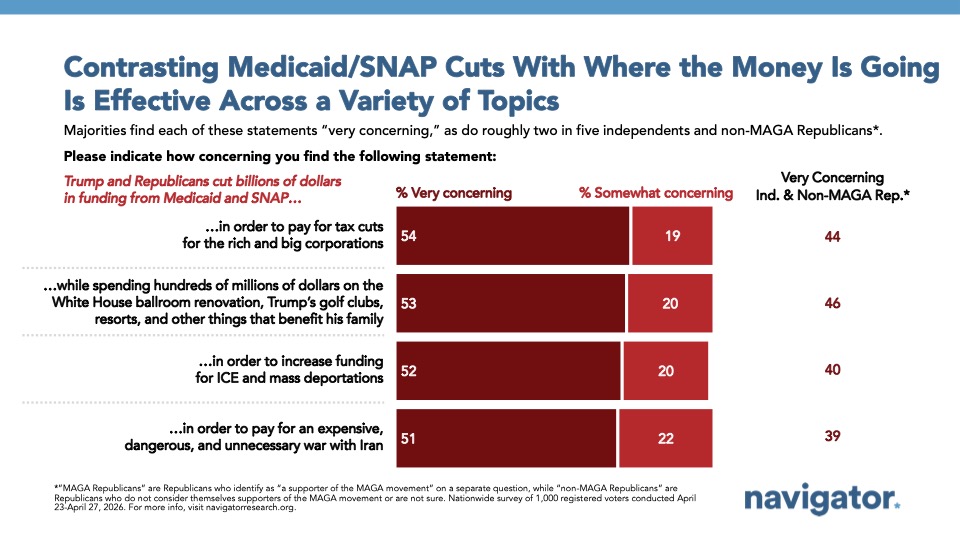
Bar chart from Navigator Research titled: Contrasting Medicaid / SNAP Cuts With Where the Money is Going is Effective Across a Variety of Topics

Democrats in Congress can effectively position themselves as champions of the American people on the core issues of this funding fight. This is one of the few opportunities where a process story can be utilized to paint a vivid picture of Republican budget cuts ripping away food and healthcare from families, and Congressional Democrats fighting to make lives easier, not harder, for everyday Americans. 
Two Months Later: Most Americans Don’t Think Trump’s War with Iran is Worth It and See No End in Sight

Americans are Paying Attention to the War With Iran, And It’s Impacting Their Views of Trump

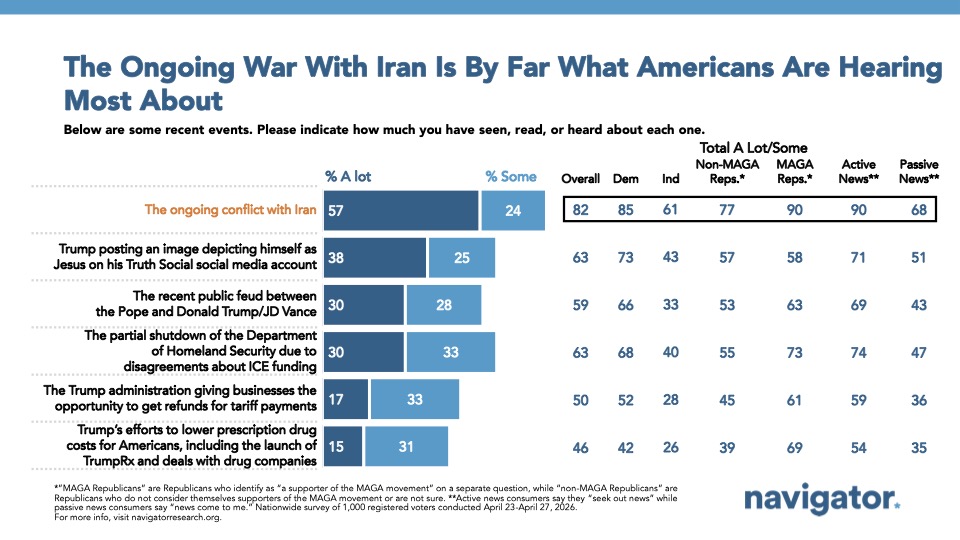
More than two months in, the U.S. war with Iran continues to dominate media headlines. More than four-in-five Americans say they’ve heard at least something about the war (82%) with a majority saying they’re hearing “a lot” (57%), more than any other news item tested in this survey.

That news is influencing Americans’ views of Trump. The war with Iran was most cited when asked what good and bad news they had heard about Trump. Of the 17% of Trump 2024 voters who say they now regret their vote, the war with Iran was the most-cited reason, followed by the economy.

A bar chart from Navigator Research titled: The Ongoing War With Iran Is By Far What Americans Are Hearing Most About

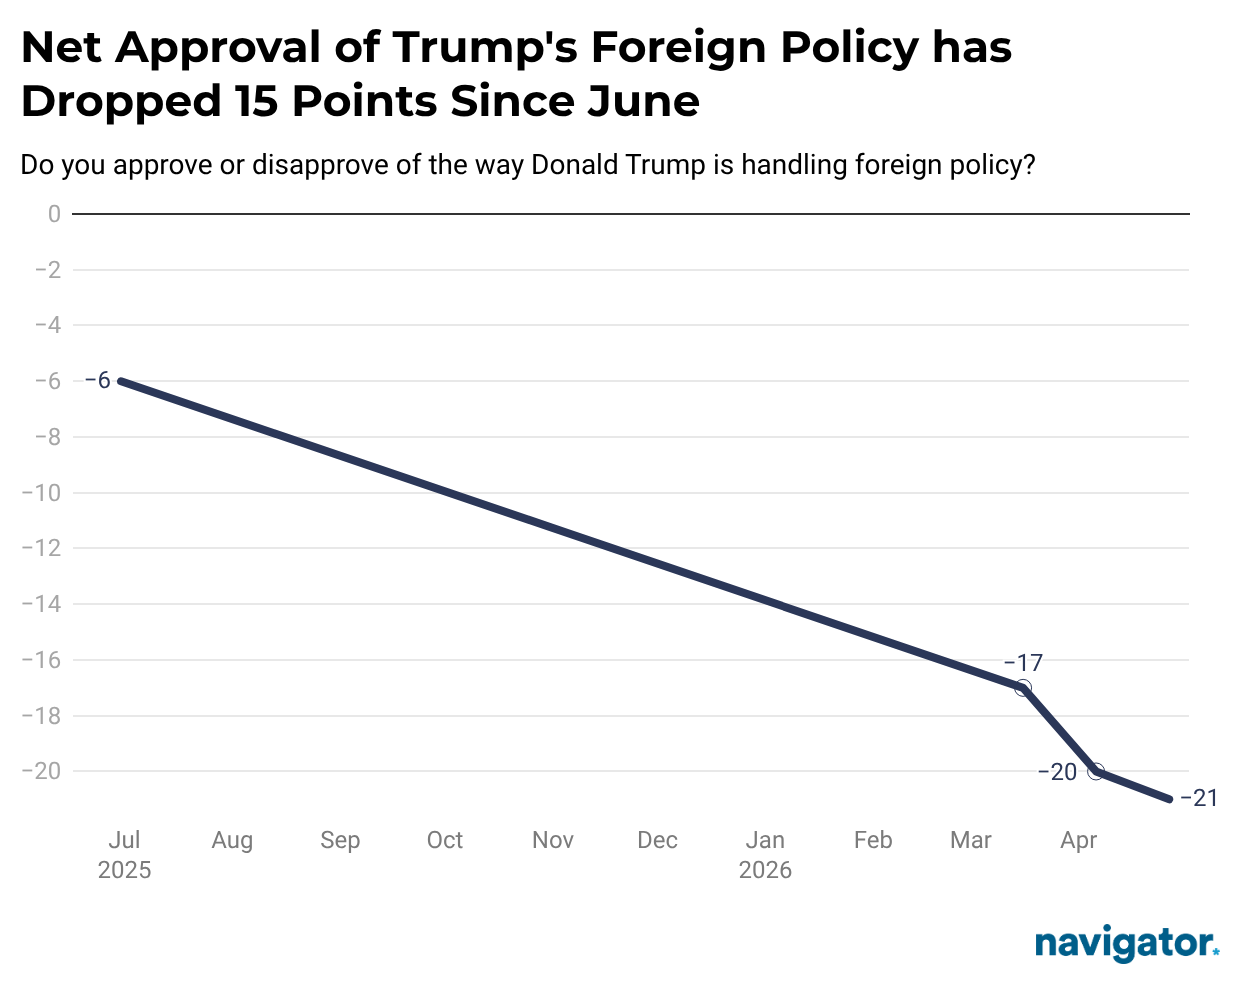
Nearly three-in-five Americans oppose Trump’s handling of foreign policy (58%), including two-thirds of independents (67%). Trump’s net approval on foreign policy has fallen 15 points from -6 in June 2025 to -21 today.

Americans Don’t Think the War with Iran is Worth it

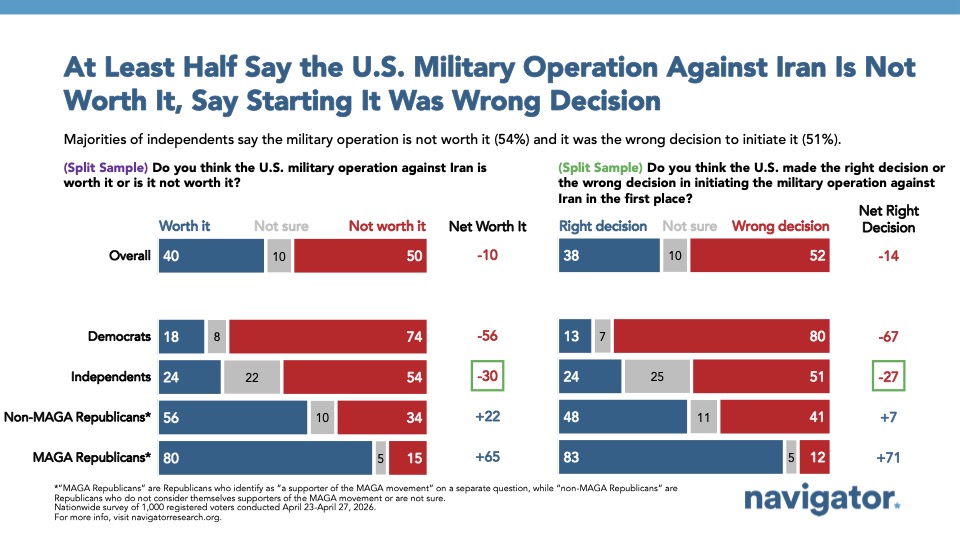
Half of Americans say the war with Iran is not worth it (50%). This includes a majority of independents (54%), nearly one-in-four Republicans (24%), and more than a third of non-MAGA Republicans (34%)

Bar chart from Navigator Research titled: At Least Half Say the U.S. Military Operation Against Iran Is Not Worth It, Say Starting It Was Wrong Decision

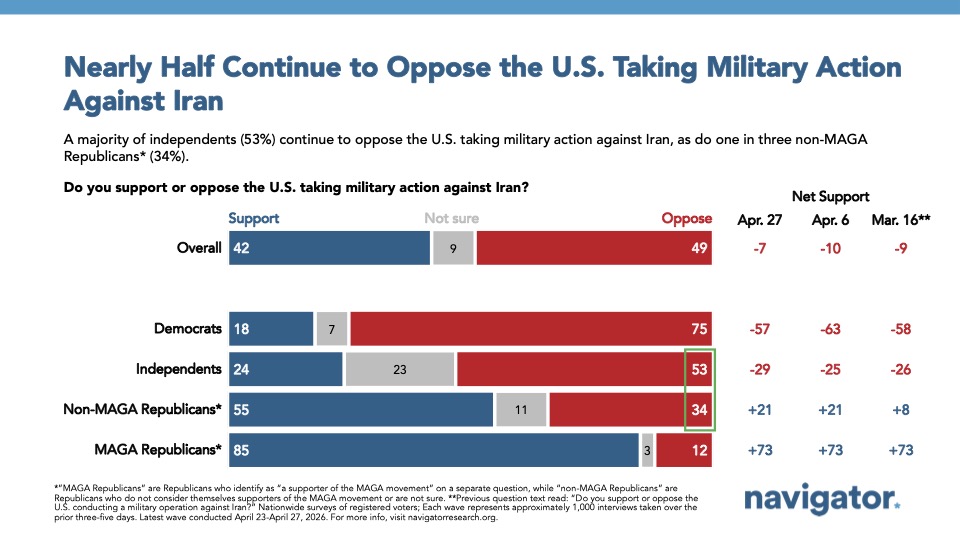
Opposition to U.S. military action against Iran is about the same, with half opposed (49%). This is a view shared by more than one-in-five Trump 2024 voters (21%) and a third of non-MAGA Republicans (34%).

Bar chart from Navigator Research titled: Nearly Half Continue to Oppose the U.S. Taking Military Action in Iran

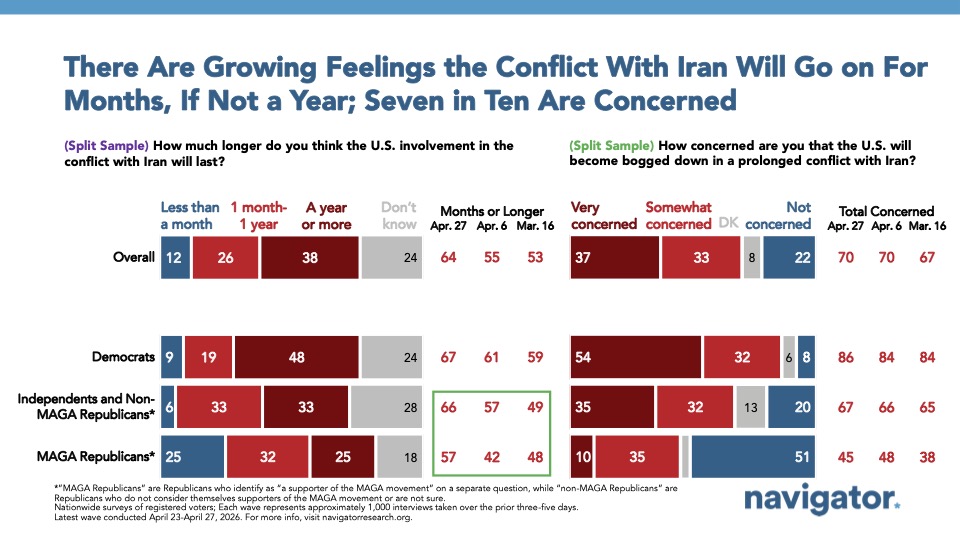
Americans are Increasingly Worried About Being Bogged Down in War with Iran

A growing share of Americans expect the war with Iran to drag on. Nearly two-thirds now say the conflict will last months or longer (64%), up 11 points since March (53%), with 38% expecting it to continue for a year or more (up from 30% in March). 

Seven-in-10 Americans are worried the U.S. will be bogged down in a conflict with Iran (70%), including a majority of Republicans (55%). 57% of Americans continue to say that Trump doesn’t have a clear plan or timeline for the war, including a majority of independents (58%) and 30% of Republicans.

Bar chart from Navigator Research titled: There Are Growing Feelings the Conflict With Iran Will Go on For Months, If Not a Year; Seven in Ten Are Concerned

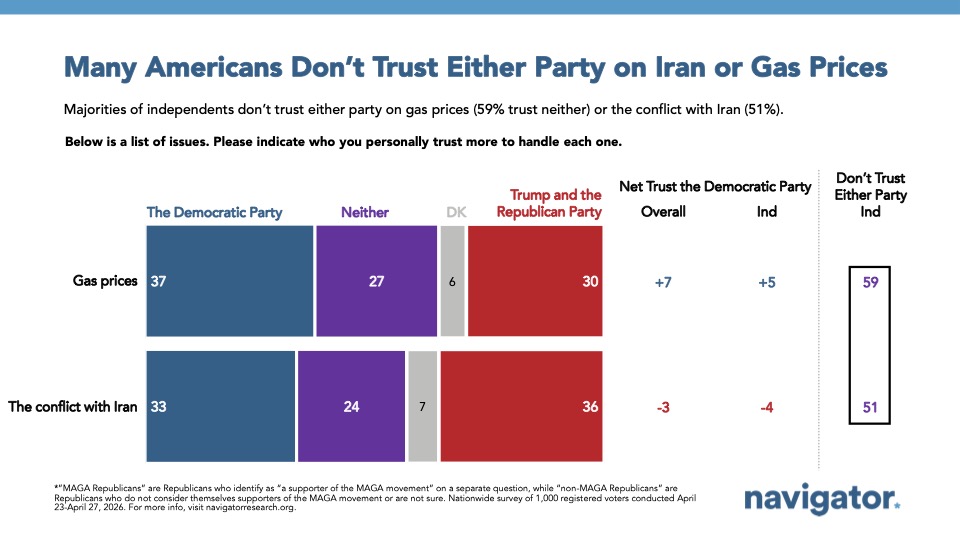
A Quarter of Americans Don’t Trust Either Party on the War with Iran

In March, President Trump and the Republican Party held an eight-point trust advantage over Democrats on the war with Iran (39% – 31%, respectively). In the past month, that advantage narrowed to just three points (President Trump and Republicans – 36% – Democrats – 33%). However, 24% of Americans, including a majority of independents (51%) say they trust neither party on the war.

Bar graph from Navigator Research titled: Many Americans Don't Trust Either Party on Iran on Gas Prices

SPECIAL REPORT: Who Do Americans Trust

Today’s Navigator Research special report concerns one of the most important questions in politics: who do you trust? Pulling from Navigator’s longitudinal data, this report details how Americans’ trust in each major political party has shifted over the course of President Trump’s second term. Overall, these results suggest an improved environment for the Democratic Party – albeit one also demonstrating the public’s significant distrust with both parties. 

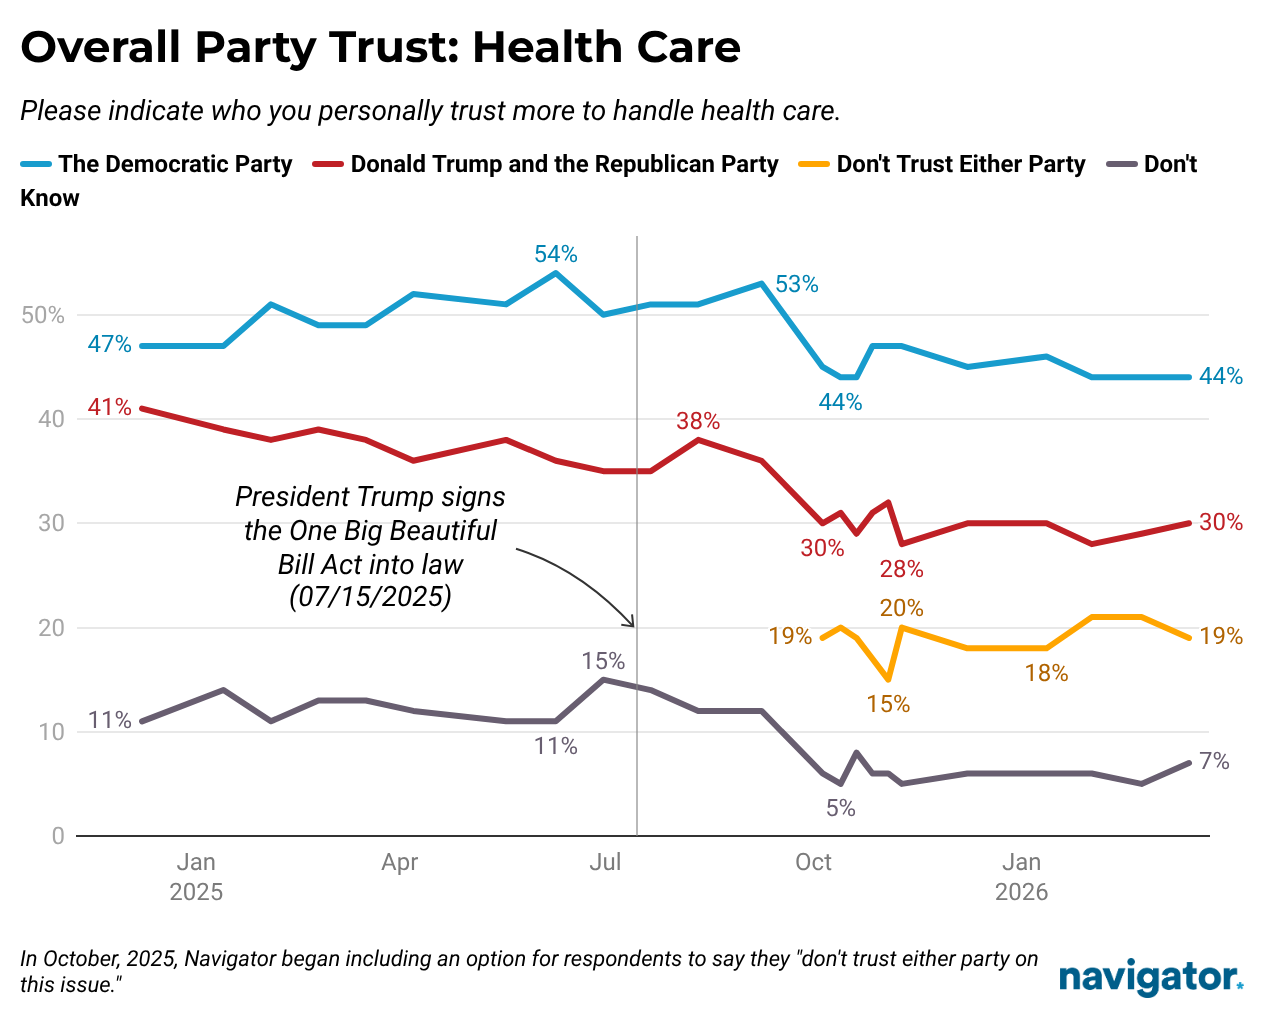
Health Care

Democrats enter the conversation on health care with a clear advantage on party trust. Since December 2024, Americans have remained more trusting of the Democratic Party than President Trump and the Republican Party to handle health care. Trust in the Democratic Party on the issue peaked in June 2025, during the height of the health care debate surrounding the One Big Beautiful Bill Act, with 54% of Americans reporting more trust in the Democratic Party. In October 2025, when Navigator Research began providing respondents with a “don’t trust either party” option in surveys, trust in both parties fell (-8% for Democrats, -6% for Republicans). Today, nearly one in five Americans say they do not trust either party (19%).

Line graph from Navigator Research titled: Overall Party Trust: Health Care

Inflation and the Cost of Living

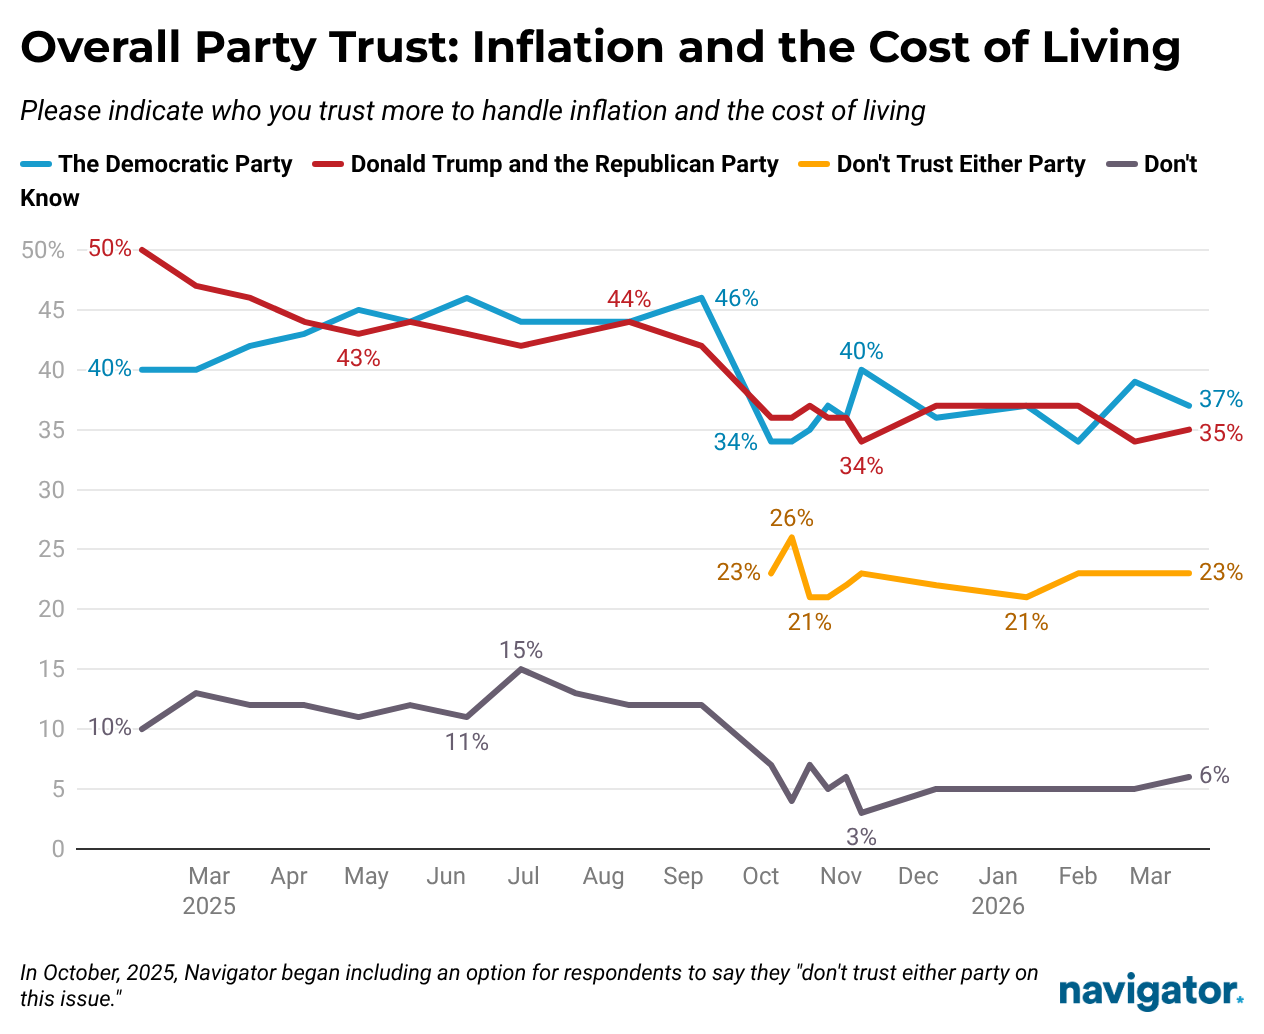
While more Americans reported greater trust in President Trump and the Republican Party on handling inflation and the cost of living in February 2025 (50% trusted Republicans – 40% trusted Democrats), since April 2025 party trust has been roughly even, with the parties trading narrow month-to-month leads in trust. 

After Navigator allowed respondents to say they do not trust either party on the issue, overall trust declined significantly for both parties. The month the change was made, trust in the Democratic Party dropped 12% and trust in the Republican Party dropped 8%. This aligns with Navigator-hosted focus groups where many participants express frustration and disappointment with both political parties

Today, Americans’ are mixed on who they trust on handling inflation and the cost of living, but lean towards the Democratic Party (34% trust Republicans – 37% trust Democrats). Around a quarter say they do not trust either party to handle inflation and the cost of living (23%), including 47% of independents.

Line graph from Navigator titled: Overall Party Trust: Inflation and the Cost of Living

Immigration

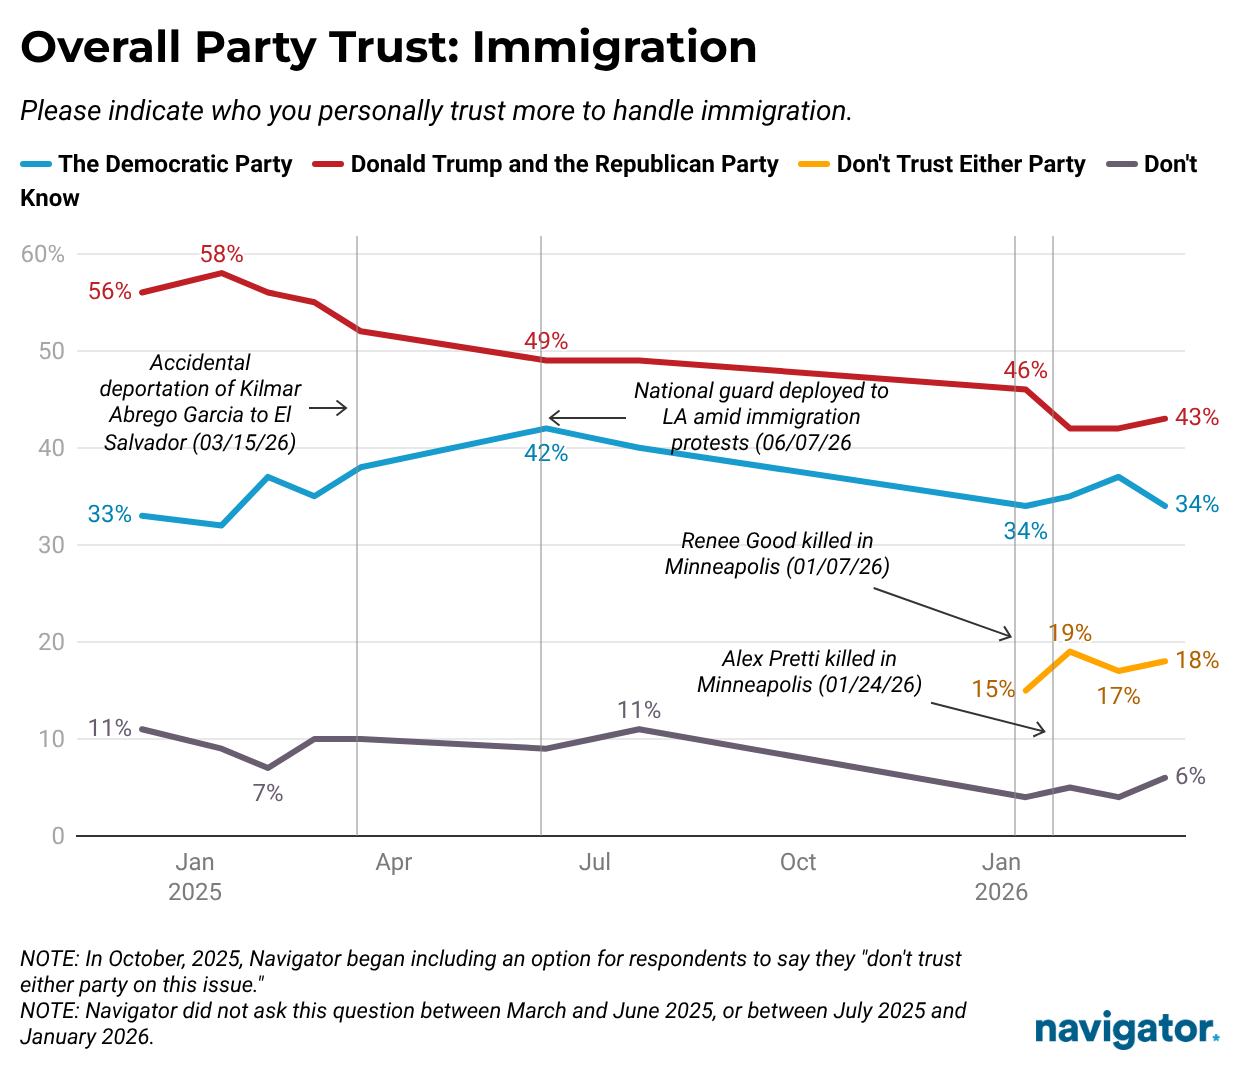
In January 2025, almost six-in-10 Americans said they trusted President Trump and the Republican Party more to handle immigration (58%). In late June 2025 – six months into the second Trump administration – trust in the Republican Party had dropped nine points (58% → 49%). While Navigator did not ask about trust on immigration between June 2025 and January 2026, when Navigator did reintroduce the question (now including a “don’t trust either party” option) trust in the Republican Party had shifted to 46%. Trust in the Republican Party further dropped after January– hitting an administration-low 42% in February 2026.

Sharper drops in trust in the Republican Party show a reaction to news reports of the Trump Administration’s immigration actions:

Line graph from Navigator Research titled: Overall Party Trust: Immigration

Getting Things Done

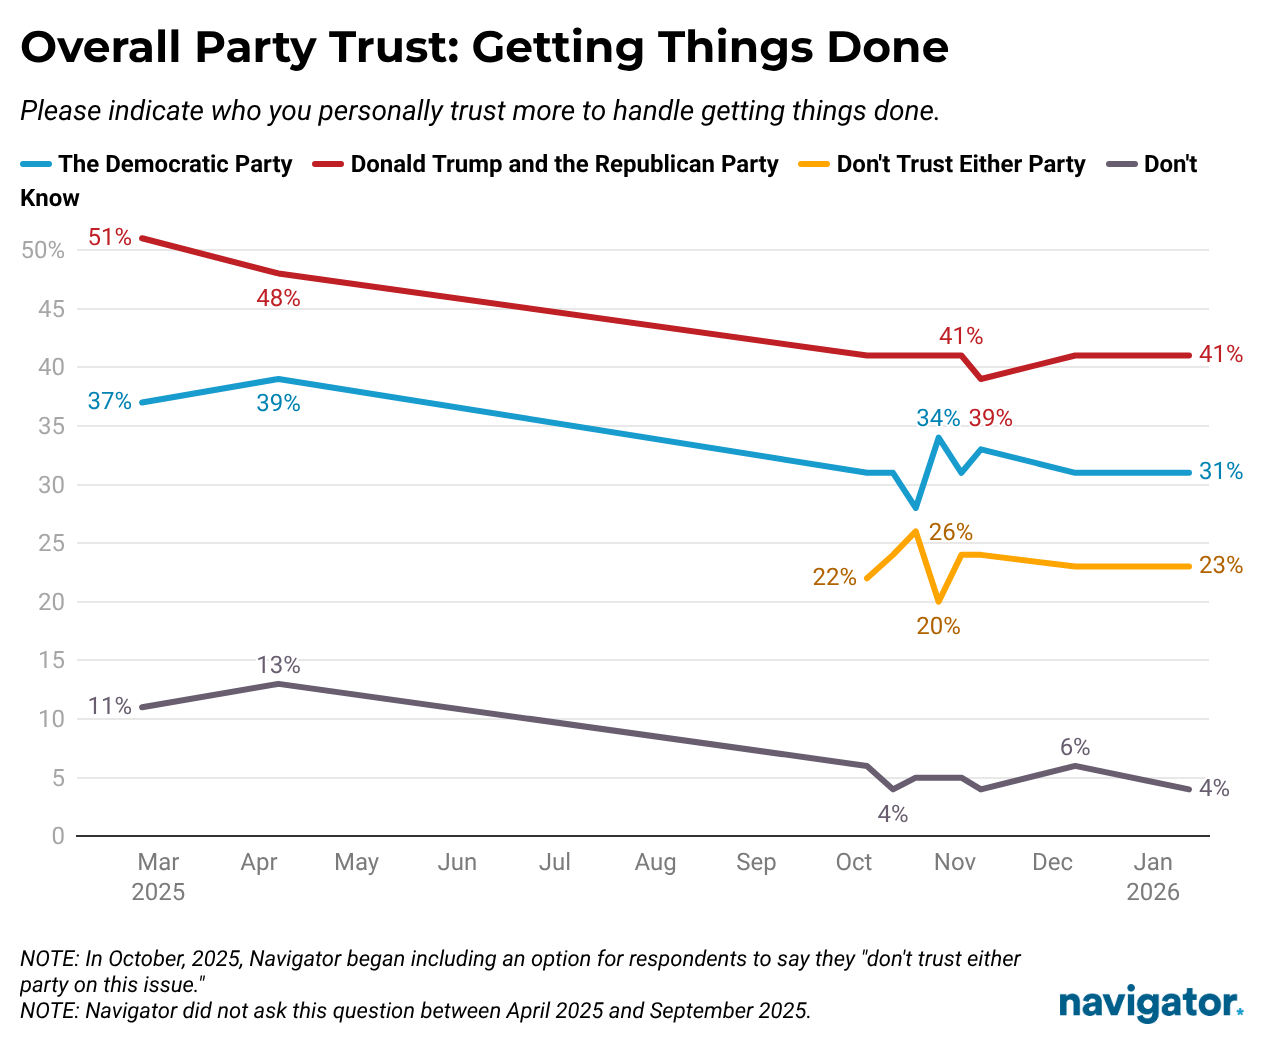
Americans today are ten points more likely to trust President Trump and the Republican Party on getting things done (41% trust President Trump and the Republican Party more – 31% trust the Democratic Party more). Notably, nearly a quarter say they do not trust either party to get things done (23%).

In April 2025, before allowing respondents to say they did not trust either party, 48% of Americans reported more trust in President Trump and the Republican Party on getting things done, while 39% reported more trust in the Democratic Party. When allowing respondents to indicate they did not trust either party in October 2025, overall trust dropped seven percent for the Republican Party and eight percent for the Democratic Party (48% → 41% and 39% → 31%, respectively).

Line graph from Navigator Research titled: Overall Party Trust: Getting Things Done

Looking Out for People Like Me

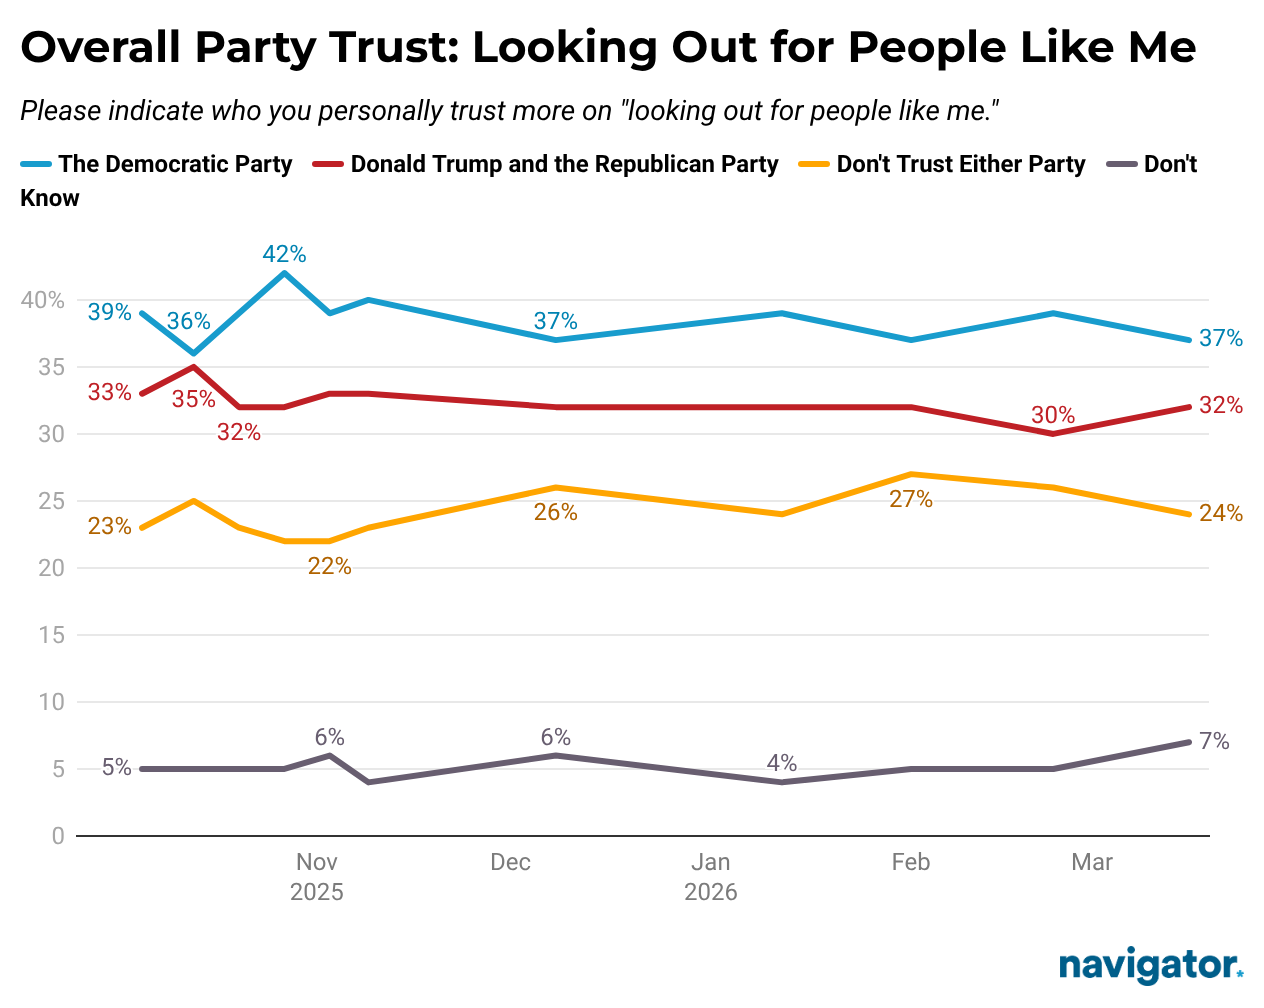
Overall, Americans today are modestly more likely to say they trust the Democratic Party on “looking out for people like me” than President Trump and the Republican Party (net +5). Just over three-in-10 Americans (31%) say they either “do not trust either party” (23%) or “don’t know” which party they trust more to look out for people like them (7%).

Line graph from Navigator Research titled: Overall Party Trust: Looking Out for People Like Me

We see this frustration with politicians echoed in Navigator’s focus group research:

“I think all politicians suck. They say, ‘I’m going to do this and do that, and I’ll give you a candy cane.’ But yet they don’t do this and they don’t do that and they don’t give you the candy cane. They just want to have your vote and then they do what they want, just like Trump’s doing.” – ME woman, independent

“I can’t think of anybody [that gets it]. I think if they’re elected officials, they’ve run a campaign. They’ve gotten a lot of money. And like he said if they did experience hardship, it was a long time ago.” – MI woman, weak Democrat

Independents Don’t Trust Either Party on a Range of Issues

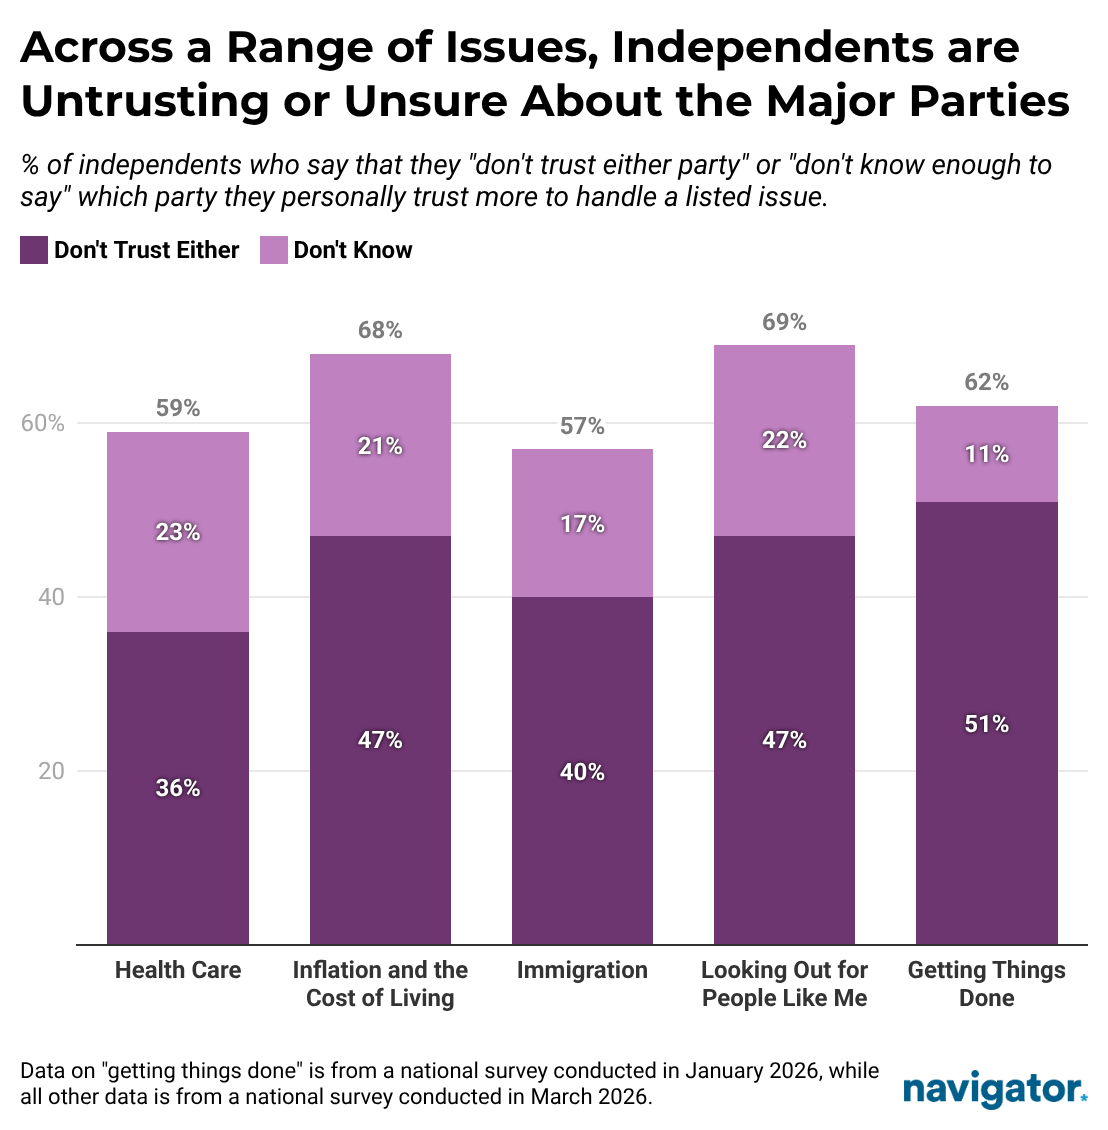
Across each issue examined in this report, a majority of independents say they either “don’t trust either party” or that they “don’t know enough to say” which party they personally trust more to handle a given issue. Independents’ high distrust and uncertainty presents an opportunity to deliver strong, solutions-oriented messaging and action on crucial issues – both to mobilize independents towards real fixes and to improve trust that the Democratic Party cares about people like them and is capable of “getting things done” to solve real problems.

Bar chart from Navigator Research: Across a Range of Issues, Independents are Untrusting or Unsure About the Major Parties

One in Five Trump 2024 Voters Regret Their Vote 

One in five Americans who voted for President Trump in 2024 now say they regret it — a share that has held steady across Navigator’s most recent surveys. This report examines who these “Trump regretters” are, what issues may be driving their remorse, and where they turn for news.

Trump Regretters are Younger

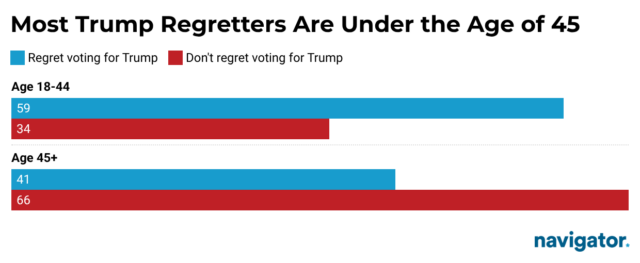
Trump regretters are much younger than other Trump voters. A majority of Trump regretters are younger than 45 (59%), including one-in-five who are under 30 (23%). Non-regretters tend to be older, with two-in-three over 45 (66%), including one-in-three who are over 65 (33%). Beyond age, Americans who regret their vote for Trump in 2024 are similar to those who don’t by gender, income, race, religion, and education. 

  • A plurality of regretters describe themselves as “moderate” (43%) – compared to 27% of non-regretters who say the same. 41% of regretters describe themselves as either “somewhat” or “very” conservative, compared to 68% of non-regretters. 
Bar graph from Navigator Research titled: Most Trump Regretters Are Under the Age of 45

Trump Regretters Have Mixed Views of the Republican Party

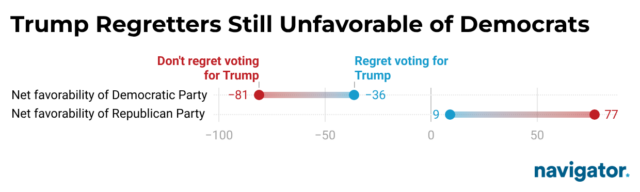
Trump regretters have mixed feelings about the Republican Party: 52% view it favorably versus 43% unfavorably — a nine-point margin that stands in sharp contrast to non-regretters, who are overwhelmingly favorable toward the Republican Party (88%). Though Trump regretters are somewhat split on their views of the Republican Party, their views of the Democratic Party are more certain, with two-in-three viewing the Democratic Party negatively (30% favorable – 66% unfavorable), although here too, regretters depart from non-regretters, who are even more negative toward Democrats.

That negativity extends beyond party politics: 64% of Trump regretters believe the country is on the wrong track, while only 33% believe it is headed in the right direction. Non-regretters see things almost in mirror image with 70% saying the country is headed in the right direction and only 22% believing it’s off course.

Dot range plot from Navigator Research titled: Trump Regretters Still Unfavorable of Democrats

Economy, Tariffs, and ICE all Underwater Among Trump Regretters

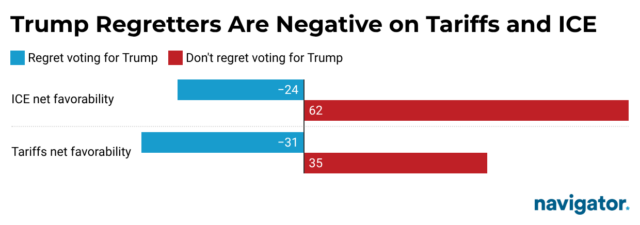
Key pillars of Trump’s first term have fallen flat with regretters. A majority of regretters say the economy is either “poor” or “not so good” (64%), compared to only 35% who rate the economy positively. Regretters’ views of tariffs are underwater by 31 points (30% favorable – 61% unfavorable), compared to non-regretters who view tariffs favorably by 35 points (62% favorable – 27% unfavorable). And it’s not just about the economy – regretters view ICE negatively by 24 points (34% favorable – 58% unfavorable), compared to non-regretters who hold overwhelmingly favorable views of ICE (net +62; 79% favorable – 17% unfavorable).

Bar graph from Navigator Research titled: Trump Regretters Are Negative on Tariffs and ICE

Trump Regretters More Likely to Turn to Social Media for News

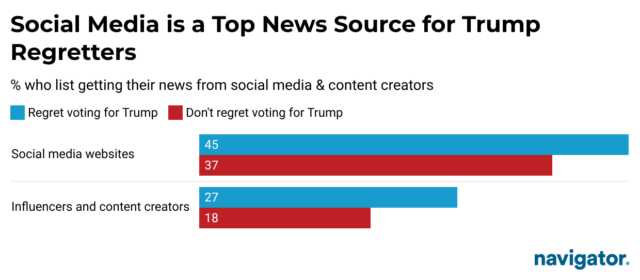
Trump regretters and non-regretters consume news at nearly identical rates: about 61% from both groups actively seek it out, while 39% are passive news consumers, meaning the news comes to them . But Trump regretters are more likely to get their news from social media. 45% of Trump regretters use social media websites as a news source, compared to 37% of non-regretters. Similarly, 27% of Trump regretters get news from social media influencers or creators, while only 18% of non-regretters say the same. 

Bar graph from Navigator Research titled: Social Media is a Top News Source for Trump Regretters

Fraud Is Real. Cuts Are Worse. How to Win This Fight.

Overview

Americans believe fraud exists in a wide range of government-run programs, and blame varies from benefit recipients to the president to members of Congress. An effective strategy to address fraud should not deny this reality, but focus on the impact GOP policies will have not on combatting fraud, but on hurting everyday families.

The bottom line: While Americans are worried about both fraud and budget cuts, when forced to choose they are far more worried about cuts. Denying, dismissing, or minimizing fraud works against us.

Background

Allegations of fraud have been a main line of attack from Republican lawmakers, increasingly framing the focus on misuse of public funds in Democratic-led states. Cases in Minnesota have repeatedly been cited as evidence of systemic failures by Democratic governors, intending to make fraud appear endemic in blue states. Additionally, the Trump administration recently announced the “National Fraud Enforcement Division” to “zealously investigate and prosecute” fraud, while using allegations as justification to cut millions in funding for health care in states. 

What The Data Is Showing

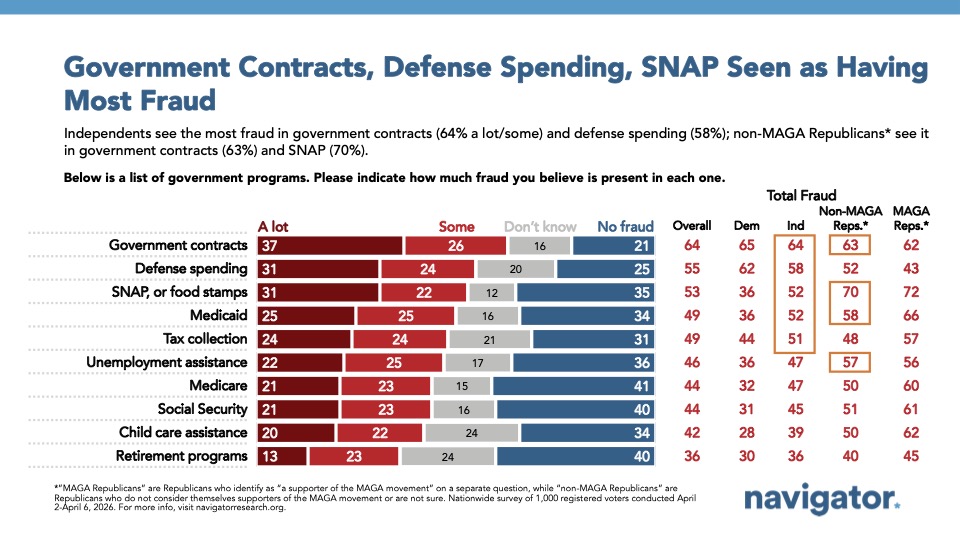
Contrary to the GOP narrative, Americans don’t see benefit programs as the biggest source of waste and fraud, they see government contracts as the top source. A majority believe fraud exists in government contracts (64% fraud – 21% no fraud) and defense spending (55% fraud – 25% no fraud), over SNAP (53% fraud – 35% no fraud) and Medicaid (49% fraud – 34% no fraud). Additionally notable as Americans are concerned about fraud in defense spending, they are also overwhelmingly opposed to Congress providing $200 billion in additional funding for the war in Iran. 

Bar graph from Navigator Research titled, Government Contracts, Defense Spending, SNAP Seen as Having Most Fraud

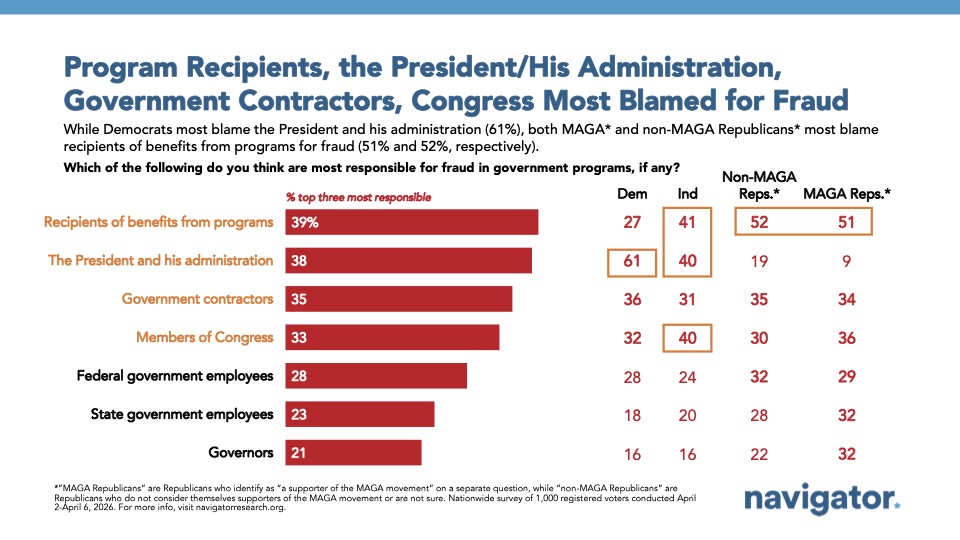
Americans are divided on who bears responsibility for fraud in government programs – 39% blame program recipients, while 38% point to President Trump and his administration. That split, however, breaks sharply along partisan lines. While blaming people on government programs for fraud is driven more heavily by older Americans, Republicans, and white men, in order to meet Americans where they are in our communications, we cannot build a winning message by first refuting what people feel is reality. Effective communication acknowledges the real concerns people have, then moves quickly to what’s actually at stake: who gets hurt by the policy response, and how.

Bar graph from Navigator Research titled, Program Recipients, the President/His Administration, Government Contractors, Congress Most Blamed for Fraud

Notably, state officials and governors are least blamed for fraud in government programs, and could be effective messengers in this fight.

While Americans are concerned about fraud in government programs, they do not believe the answer is in cuts to basic needs families depend on. Context matters; people don’t believe it is possible to cut fraud without kicking people off of health care. From Navigator’s June 2025 survey, fielded shortly before the passage of the Republican budget known as the One Big Beautiful Bill Act, a majority of Americans (51%), including a plurality of independents (46%), believed it would be impossible to cut “waste, fraud, and abuse” without kicking people off of Medicaid. 

Americans are overwhelmingly concerned about cuts to benefit programs like health care, and while the best messages should not deny the reality that fraud exists, a successful counter message takes accountability, and more importantly, addresses impact

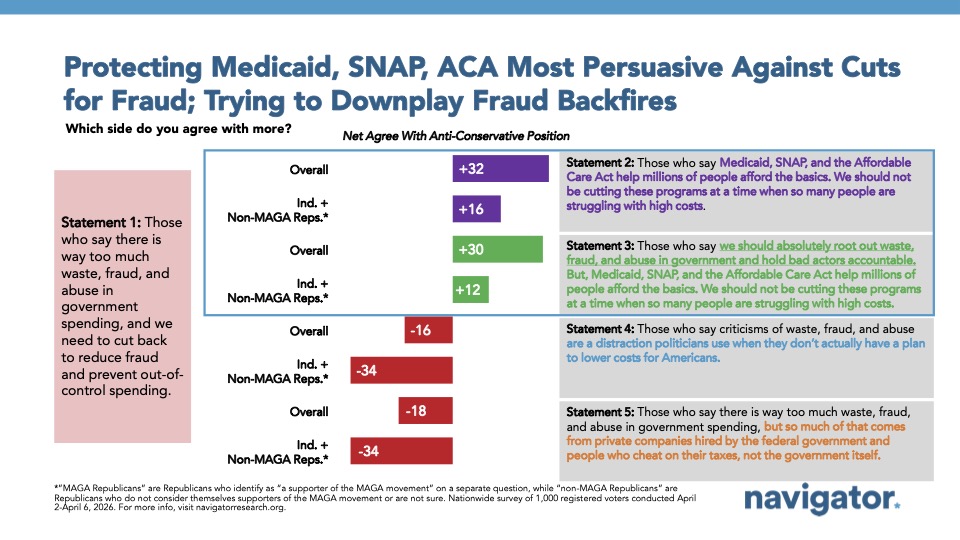
By more than +30 points, and double digits for independents and non-MAGA Republicans, Americans agree that the need to cut spending and reduce fraud is nota justification for cutting programs which help millions afford the basics at a time when people are already struggling with high costs. While Americans may believe fraud exists in government contracts, the more effective message to counter the attack centers on the impact of cutting programs people rely on.

Slide from Navigator Research titled, Protecting Medicaid, SNAP, ACA Most Persuasive Against Cuts for Fraud; Trying to Downplay Fraud Backfires

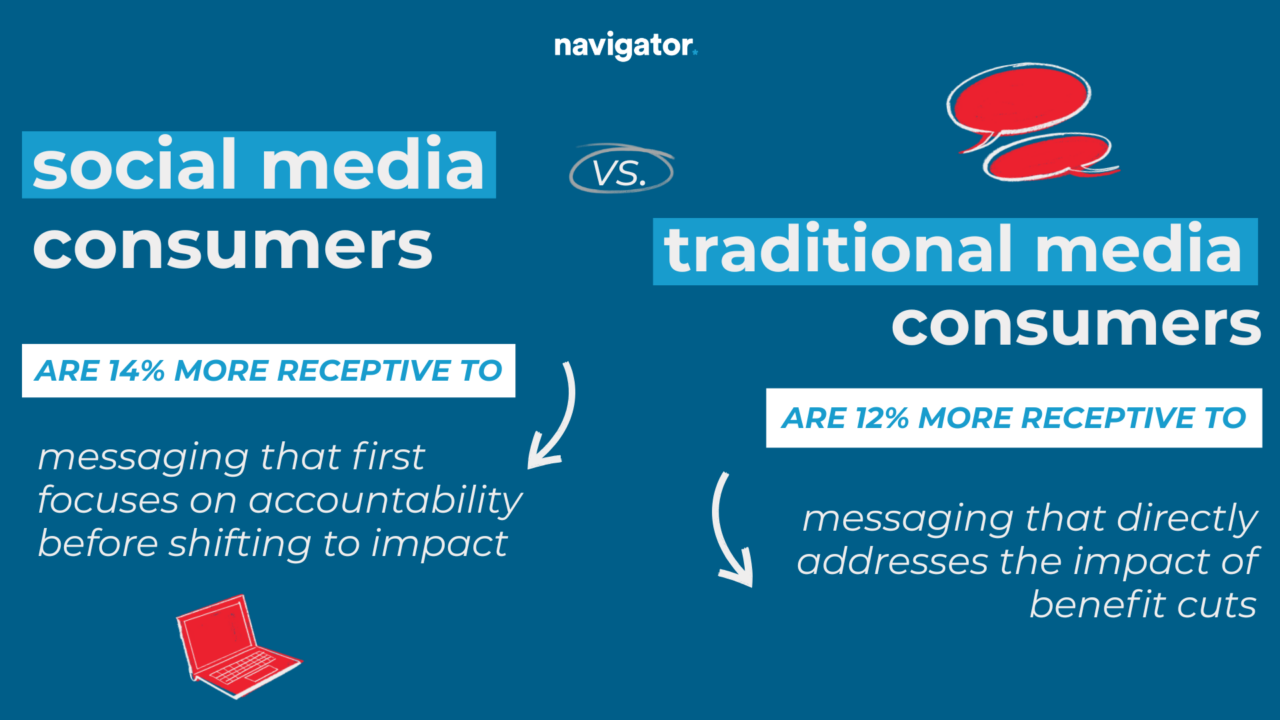
Medium and platform specific messaging will also be crucial to effectively neutralize bad faith attacks on fraud. Traditional media consumers (ie., local news, online news, radio) are more likely than social media consumers to blame recipients for fraud in benefits programs, but are more receptive to messaging that directly addresses the impact of benefit cuts, while social media consumers are more receptive to messaging that first focuses on accountability before shifting to impact.

Graphic from Navigator

Americans recognize fraud is a real issue, but are more concerned with the harm done by cuts to benefit programs than prioritizing rooting out fraud. A winning message acknowledges reality and focuses on what voters already intuitively know—that cutting health care and access to food will harm kids and families, and is not a viable solution to address fraud.

Americans Oppose Unfair Prediction Markets Usage, Even if Few Are Following It

Americans are Mostly Unfamiliar With Prediction Markets

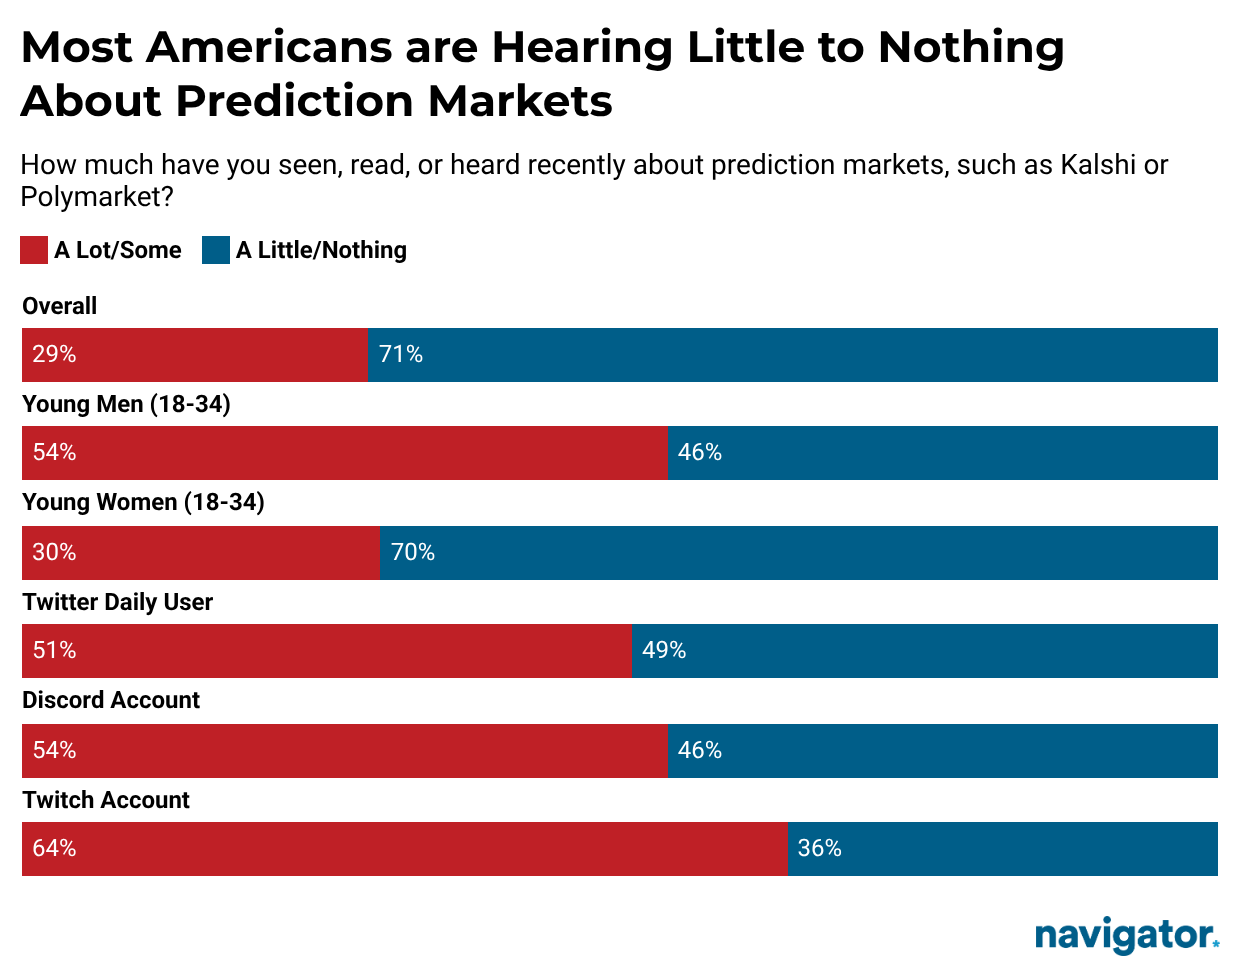
Despite their prevalence in the news and the attention on Capitol Hill, most Americans are hearing little to nothing about prediction markets. Over seven-in-10 say they have recently heard “a little” or “nothing” about prediction markets like Kalshi and Polymarket (71%).
Even among Americans who say they “frequently” or “sometimes” engage in online gambling, only 47% say they have recently heard “a lot” or “some” about prediction markets – and over one-third say they’ve heard nothing at all (36%).

Young men are more aware of prediction markets. Over half of men ages 18-34 say they have recently heard “a lot” or “some” about prediction markets (54%). Conversely, seven-in-10 women ages 18-34 report recently hearing “a little” or “nothing” about prediction markets (70%).

While familiarity with prediction markets is relatively similar across traditional media sources, such as local TV (28%) and radio (36%), users of a select few social media platforms have more awareness:

  • 51% of daily Twitter users say they are hearing “a lot” or “some.”
  • 54% of those with a Discord account report hearing “a lot” or “some.”
  • 64% of those with a Twitch account report hearing “a lot” or “some.”

Younger Men are Gambling or Using Prediction Markets the Most; Virtually No Baby Boomers Use Prediction Markets

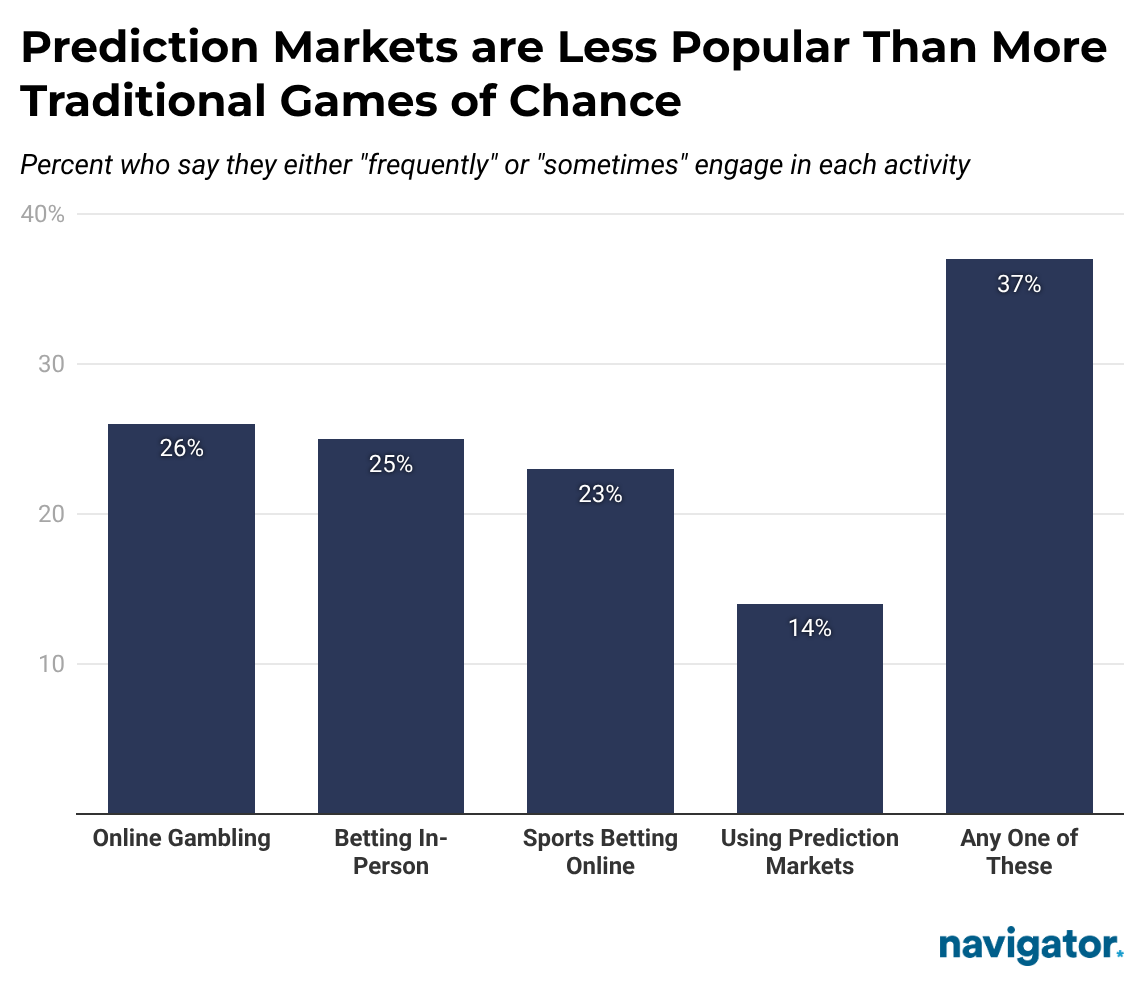
Overall, 37% of Americans are “frequently” or “sometimes” engaging in at least one of the four listed forms of gambling or prediction markets. About a quarter of Americans say they at least “sometimes” engage in online gambling, including casino games, or place bets in person (26% and 25%, respectively), while 23% report at least “sometimes” betting on sports online. 

  • Fewer Americans are using prediction markets. Only 14% report “sometimes” or “frequently” placing bets on prediction markets.
Bar graph from Navigator Research titled: Prediction Markets are Less Popular Than More Traditional Games of Chance

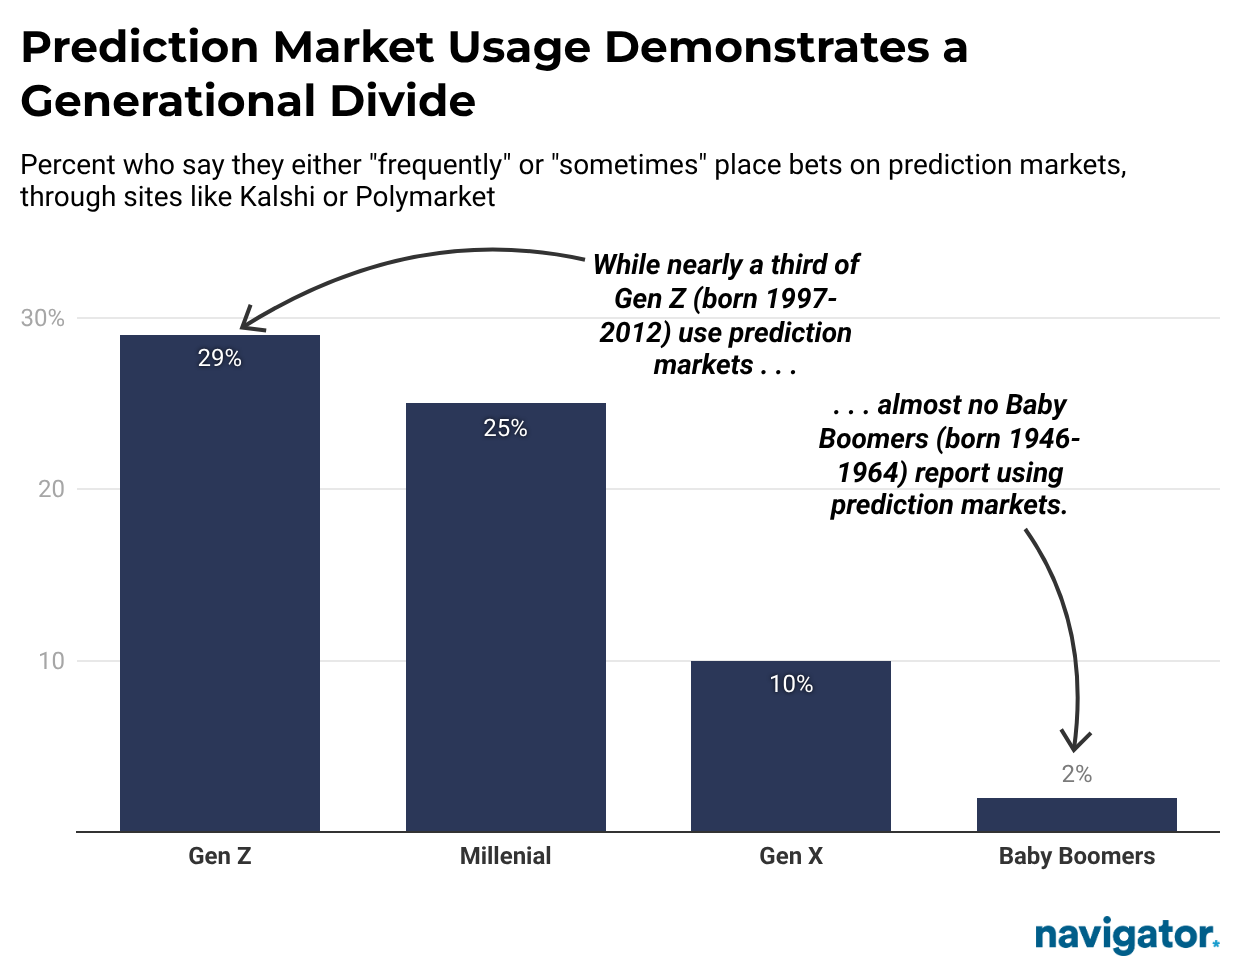
Younger Americans gamble more. Around four-in-10 Gen Z or Millennial Americans “frequently” or “sometimes” participate in online gambling (42% and 40%, respectively), while just a quarter of Gen X (25%) and 8% of Baby Boomers say the same. 

This is also true of prediction markets: 29% of Gen Z report using prediction markets, compared with just 2% of Baby Boomers.

Bar graph from Navigator Research titled: Prediction Market Usage Demonstrates a Generational Divide

Young men are especially likely to gamble or engage in prediction markets. Over half of men ages 18-34 report betting on sports online (53%), compared to 38% of women ages 18-34. Young men were also more likely to use prediction markets:

  • 39% of young men (18-34) are using prediction markets.
  • 23% of young women (18-34) are using prediction markets.

A Majority Feel Prediction Markets Should be Legal in Some Form, With Specific Regulations Receiving Broad Support

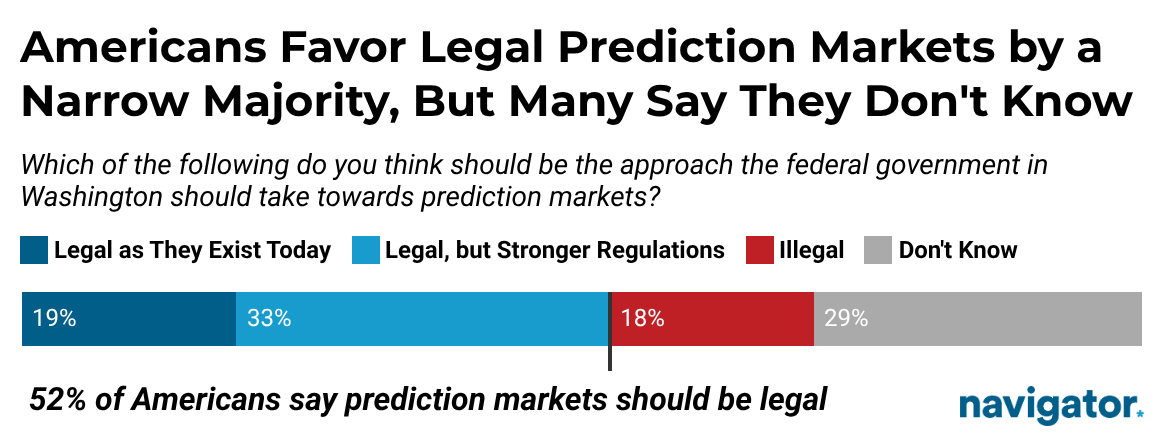
Overall, 52% of Americans say prediction markets should be legal in some capacity – with more preferring additional regulations over the status quo. A plurality of Americans say prediction markets should be legal but with stronger regulation and oversight (33%), while nearly one-in-five say prediction markets should be legal as they exist today (19%); a similar number say prediction markets should be illegal entirely (18%). Notably, almost a third of Americans say they “don’t know” how the federal government should approach prediction markets (29%). 

Bar graph from Navigator Research titled: Americans Favor Legal Prediction Markets by a Narrow Majority, But Many Say They Don't Know

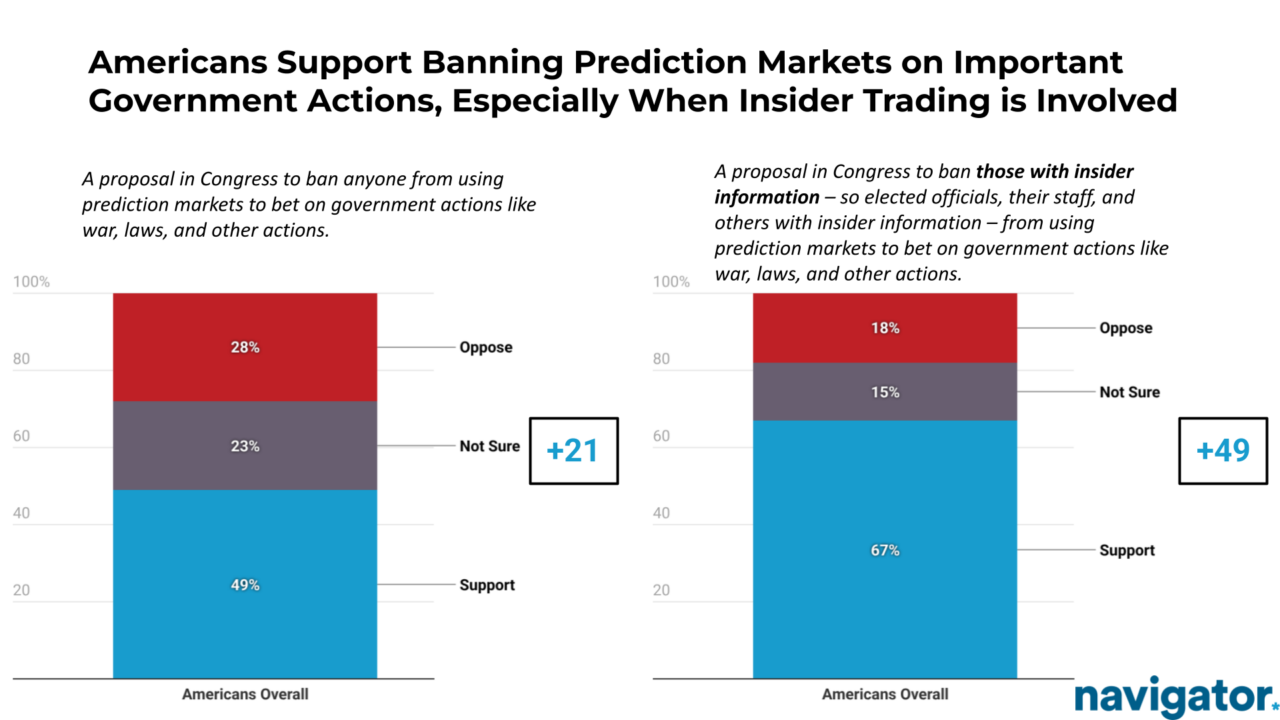
While many Americans support some form of legal prediction markets, banning those with insider information from engaging in markets on government actions is strongly supported.

  • Americans support Congress banning anyone from using prediction markets to bet on government actions like war, laws, and other actions by net 21 points (49% support – 28% oppose). Nearly a quarter of Americans say they are “unsure” if they would support such a policy (23%).

Americans support Congress banning anyone with insider information so elected officials, their staff, and others with insider information – from using prediction markets to bet on government actions like war, laws, and other actions by net 49 points (67% support – 18% oppose). 

Bar graph from Navigator Research titled: Americans Support Banning Prediction Markets on Important Government Actions, Especially When Insider Trading is Involved

Although men are more supportive than women of keeping prediction markets legal in general (61% of men say legal – 45% of women say legal), they are also more supportive of a policy limiting those with insider information from using prediction markets. Men support banning individuals with insider information from using prediction markets by net 61 points (76% support – 15% oppose), while women support the same by 39 points (59% support – 20% oppose).